1.e.3 - 2013 Q8
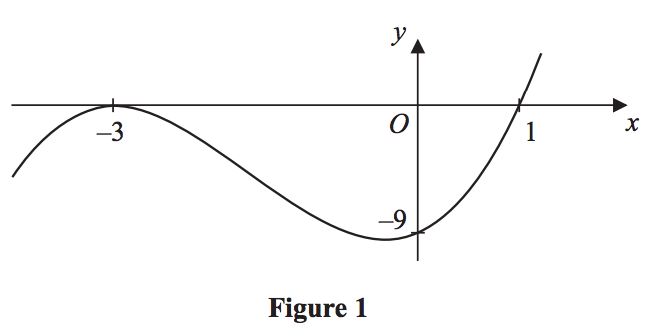
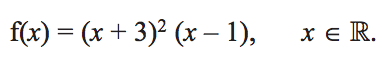
Figure 1 shows a sketch of the curve with equation y = f(x) where
The curve crosses the x-axis at (1, 0), touches it at (–3, 0) and crosses the y-axis at (0, –9)
A) sketch the curve C with equation y = f(x + 2) and state the coordinates of the points where the curve C meets the x-axis. (3)
B) Write down an equation of the curve C. (1)
C) Use your answer to part (b) to find the coordinates of the point where the curve C meets the y-axis. (2)
A) sketch the curve C with equation y = f(x + 2) and state the coordinates of the points where the curve C meets the x-axis. (3)
B) Write down an equation of the curve C. (1)
C) Use your answer to part (b) to find the coordinates of the point where the curve C meets the y-axis. (2)