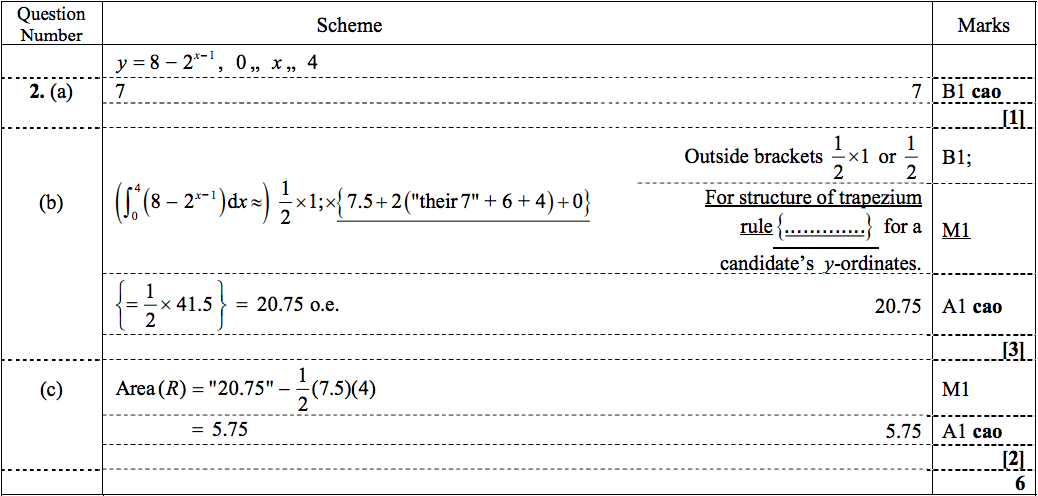
7.b.1 - 2016 Q2 Answers
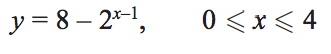
2) The curve C has equation
(a) Complete the table below with the value of y corresponding to x = 1 (1)
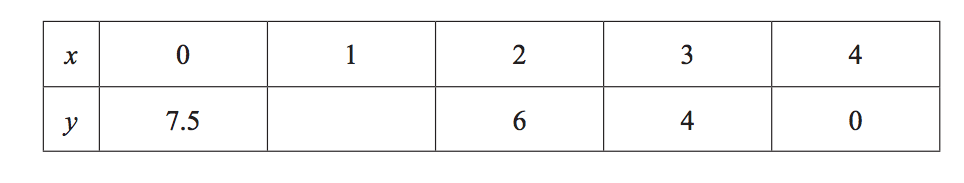
(b) Use the trapezium rule, with all the values of y in the completed table, to find an approximate value for... (3)
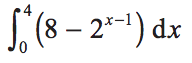
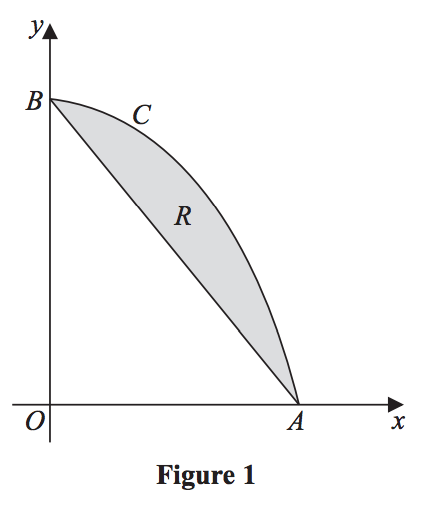
Figure 1 shows a sketch of the curve C with equation y = 8 – 2x–1, between 0 and 4.
The curve C meets the x-axis at the point A and meets the y -axis at the point B.
The region R, shown shaded in Figure 1, is bounded by the curve C and the straight line through A and B.
(c) Use your answer to part (b) to find an approximate value for the area of R. (2)
The curve C meets the x-axis at the point A and meets the y -axis at the point B.
The region R, shown shaded in Figure 1, is bounded by the curve C and the straight line through A and B.
(c) Use your answer to part (b) to find an approximate value for the area of R. (2)
Answers