??? - 2016 Q2
2.
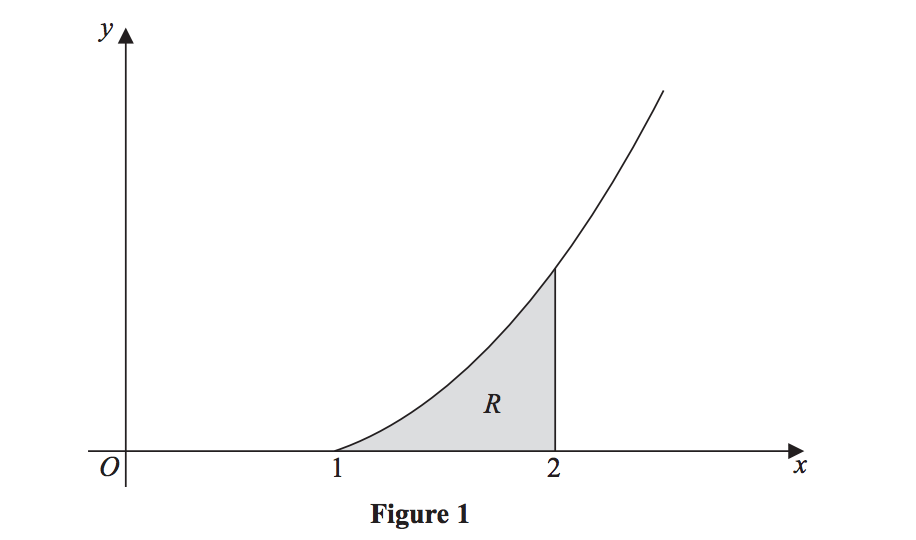
Figure 1 shows a sketch of part of the curve with equation y = x2lnx, x≥1
The finite region R, shown shaded in Figure 1, is bounded by the curve, the x-axis and the line x = 2 The table below shows corresponding values of x and y for y = x2 lnx
The finite region R, shown shaded in Figure 1, is bounded by the curve, the x-axis and the line x = 2 The table below shows corresponding values of x and y for y = x2 lnx
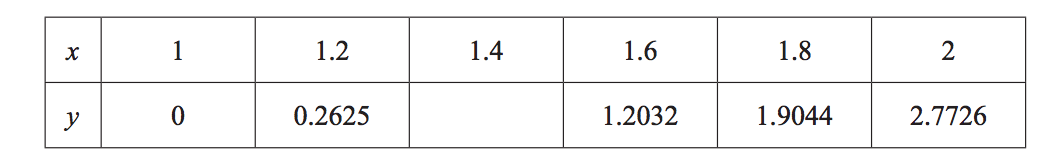
(a) Complete the table above, giving the missing value of y to 4 decimal places. (1)
(b) Use the trapezium rule with all the values of y in the completed table to obtain an estimate for the area of R, giving your answer to 3 decimal places. (3)
(c) Use integration to find the exact value for the area of R. (5)
(b) Use the trapezium rule with all the values of y in the completed table to obtain an estimate for the area of R, giving your answer to 3 decimal places. (3)
(c) Use integration to find the exact value for the area of R. (5)