??? - 2013 Q1
1
Fig. 1 shows the graphs of y = |x| and y = |ax +b|, where a and b are constants. The intercepts of y = |ax+b| with the x- and y-axes are (-1,0) and (0,1/2) respectively
Fig. 1 shows the graphs of y = |x| and y = |ax +b|, where a and b are constants. The intercepts of y = |ax+b| with the x- and y-axes are (-1,0) and (0,1/2) respectively
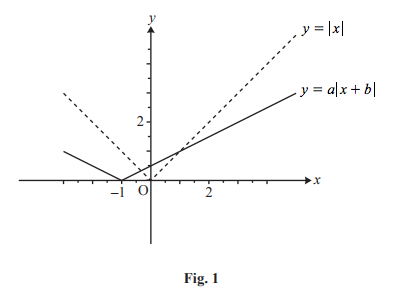
(i) Find a and b. [2]
(ii) Find the coordinates of the two points of intersection of the graphs. [4]
(ii) Find the coordinates of the two points of intersection of the graphs. [4]