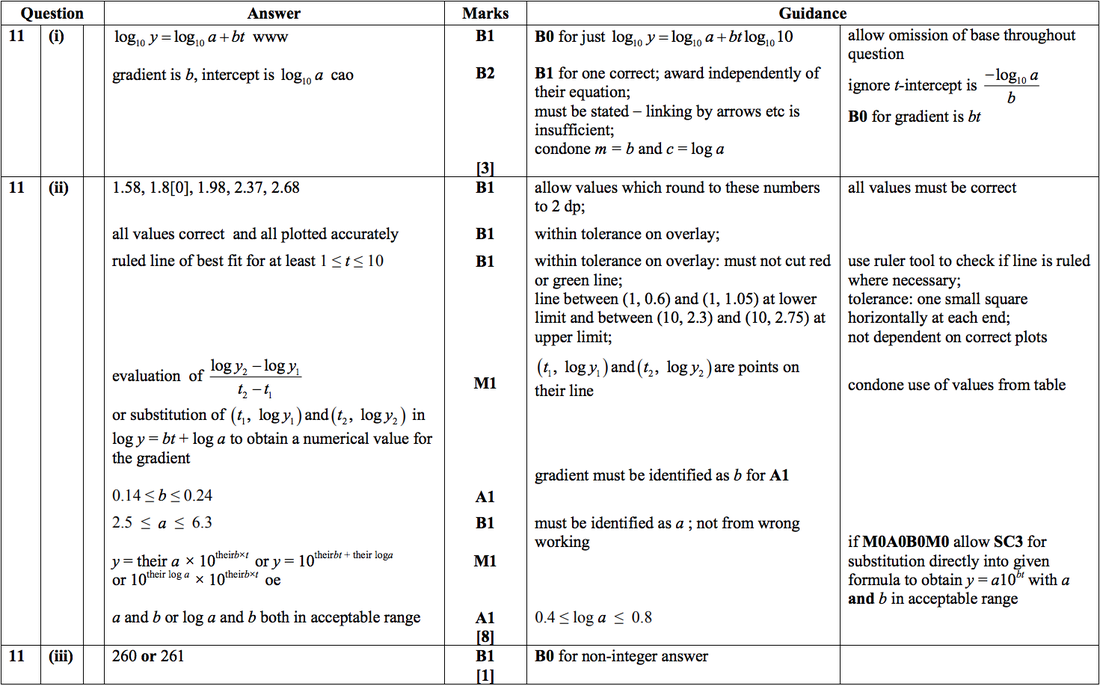
??? - 2016 JUNE Q11 Answers
There are many different flu viruses. The numbers of flu viruses detected in the first few weeks of the
2012–2013 flu epidemic in the UK were as follows.
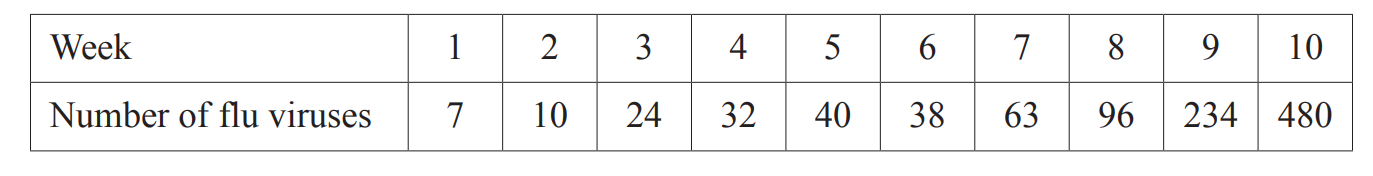
These data may be modelled by an equation of the form y = a x 10bt, where y is the number of flu viruses detected in week t of the epidemic, and a and b are constants to be determined.
(i) Explain why this model leads to a straight-line graph of log10 y against t. State the gradient and intercept of this graph in terms a and b. [3]
(ii) Complete the values of log10 y in the table, draw the graph of log10 y against t, and draw by eye a line of best fit for the data.
Hence determine the values of a and b and the equation for y in terms of t for this model. [8]
During the decline of the epidemic, an appropriate model was
y = 921 x 2--0.137w
where y is the number of flu viruses detected in week w of the decline.
(iii) Use this to find the number of viruses detected in week 4 of the decline. [1]
(i) Explain why this model leads to a straight-line graph of log10 y against t. State the gradient and intercept of this graph in terms a and b. [3]
(ii) Complete the values of log10 y in the table, draw the graph of log10 y against t, and draw by eye a line of best fit for the data.
Hence determine the values of a and b and the equation for y in terms of t for this model. [8]
During the decline of the epidemic, an appropriate model was
where y is the number of flu viruses detected in week w of the decline.
(iii) Use this to find the number of viruses detected in week 4 of the decline. [1]
Answers