
Back to AQA Maths Higher November 2018 Paper 3 Home
Q6: Question – Paper 3 – November 2018
Q6: Question – Paper 3 – November 2018
Question
Click here for a printable version of this question.
6)
A music festival has taken place each year from 2011
The table shows the number of people who attended each year.
6)
A music festival has taken place each year from 2011
The table shows the number of people who attended each year.

The festival organisers draw a time series graph to represent the data.
The first four years have been plotted.
The first four years have been plotted.
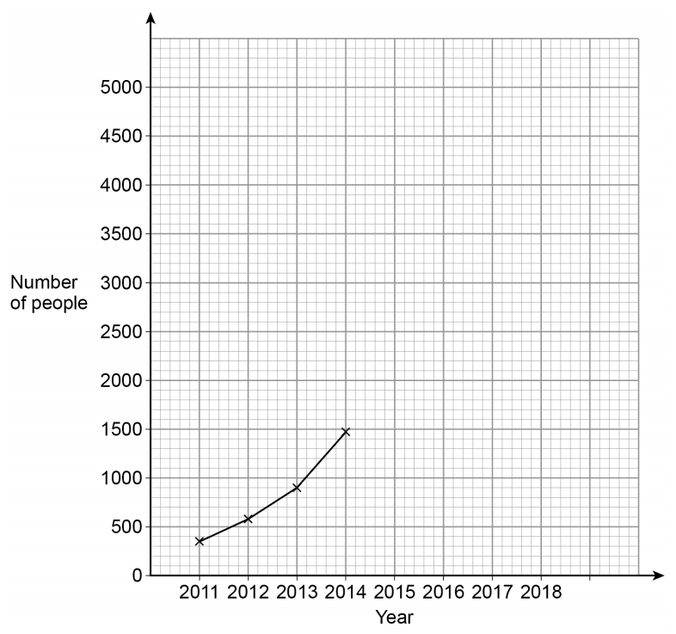
a) Complete the graph.
[2 marks]
b) Use the graph to estimate the number of people who will attend the festival in 2019
[2 marks]