Back to AQA Maths Higher June 2018 Paper 1 Home
Q19: Question – Paper 1 – June 2018
Q19: Question – Paper 1 – June 2018
Helpful Links
Question
Click here for a printable PDF of this question.
19)
Type A batteries and type B batteries were tested.
The cumulative frequency diagram shows information about the battery life of type A
19)
Type A batteries and type B batteries were tested.
The cumulative frequency diagram shows information about the battery life of type A
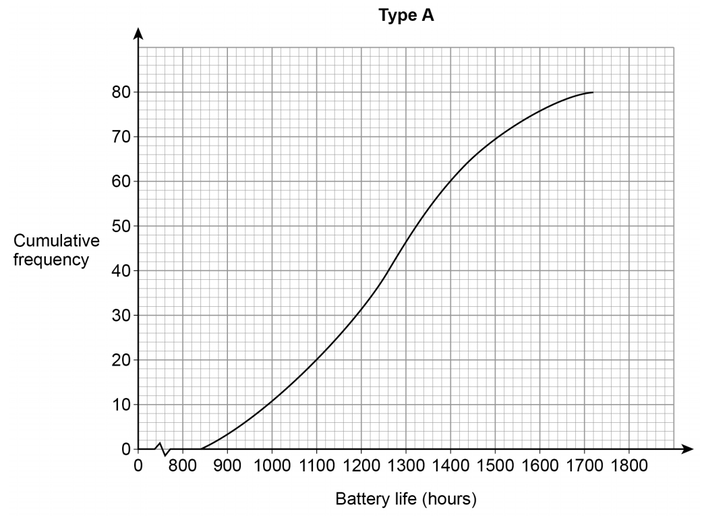
19 a) Estimate the interquartile range for type A.
[2 marks]
19 b) Estimate the number of type A batteries that had a battery life of more than 1600 hours.
[1 mark]
19 c) The box plot shows information about the battery life of type B.
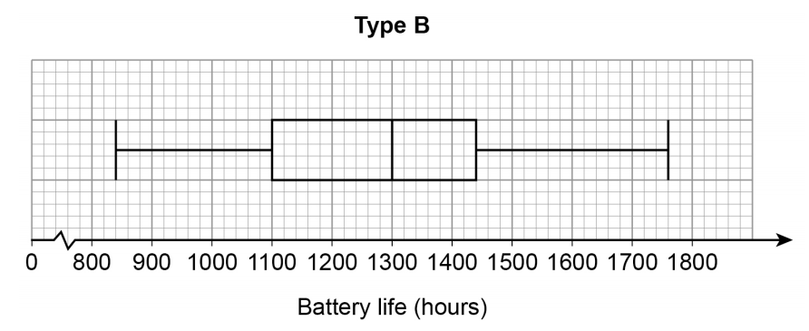
On average, which type had the greater battery life?
Tick a box.
Tick a box.

Using data from both diagrams, state how you chose your answer.
[2 marks]