Back to AQA Maths Higher June 2018 Paper 3 Home
Q26: Question – Paper 3 – June 2018
Q26: Question – Paper 3 – June 2018
Helpful Links
|
Content:
|
Question
Click here for a printable PDF of this question.
26)
The histogram shows information about the speed of cars as they pass a checkpoint.
The scale on the frequency density axis is missing.
26)
The histogram shows information about the speed of cars as they pass a checkpoint.
The scale on the frequency density axis is missing.
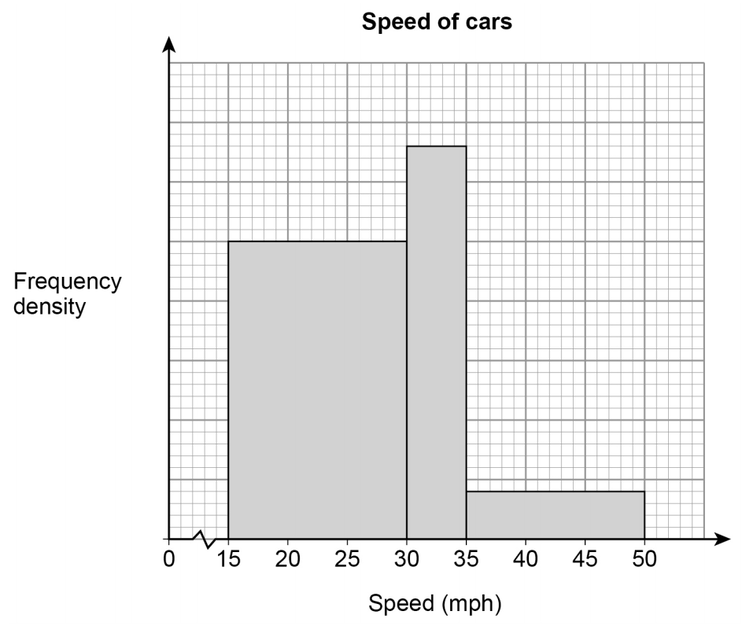
The histogram shows information about 480 cars.
a) How many cars does the first bar represent?
a) How many cars does the first bar represent?
[4 marks]
b) Cars with a speed greater than 40 mph are over the speed limit.
Use the histogram to estimate the number of cars that are over the speed limit.
[2 marks]