Back to AQA Maths Higher November 2017 Paper 3 Home
Q23: Question – Paper 3 – November 2017
Q23: Question – Paper 3 – November 2017
Helpful Links
Question
Click here for a printable PDF of this question.
23)
Joe draws this graph to identify the region R represented by
23)
Joe draws this graph to identify the region R represented by

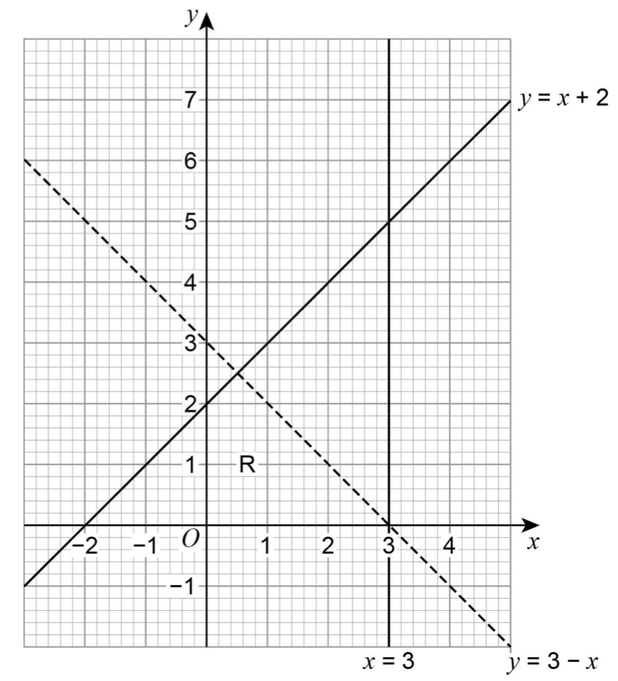
Make two criticisms of his graph.
- Criticism 1 __________________
- Criticism 2 __________________
[2 marks]