Back to AQA Maths Higher June 2017 Paper 2 Home
Q10: Question – Paper 2– June 2017
Q10: Question – Paper 2– June 2017
Helpful Links
|
Content:
|
Question
Click here for a printable PDF of this question.
10)
The pie chart shows information about voters in an election.
10)
The pie chart shows information about voters in an election.
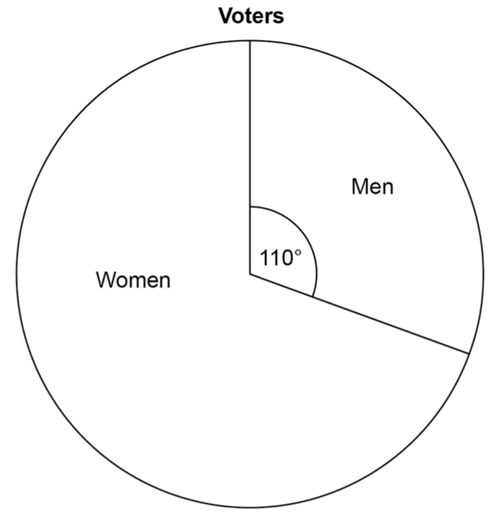
3360 more women voted than men.
Work out the total number of voters.
Work out the total number of voters.
[3 marks]