Back to AQA Maths Higher June 2017 Paper 2 Home
Q6: Question – Paper 2– June 2017
Q6: Question – Paper 2– June 2017
Helpful Links
Question
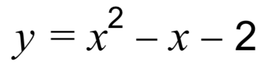
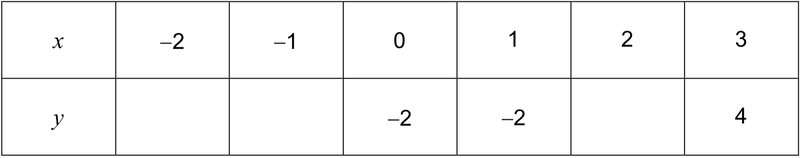
[2 marks]
b) Draw the graph of

for values of x from −2 to 3
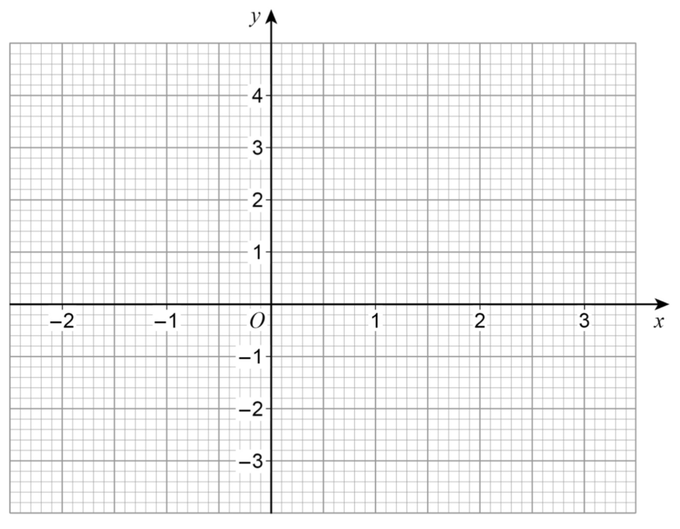
[2 marks]
c) Write down the x-coordinate of the turning point of the graph.
[1 mark]