Back to Edexcel Maths Higher November 2018 Paper 1 Home
Q9: Question – Paper 1 – November 2018
Q9: Question – Paper 1 – November 2018
Helpful Links
Question
Click here for a printable PDF of this question.
9)
The times that 48 trains left a station on Monday were recorded.
The cumulative frequency graph gives information about the numbers of minutes the trains were delayed, correct to the nearest minute.
9)
The times that 48 trains left a station on Monday were recorded.
The cumulative frequency graph gives information about the numbers of minutes the trains were delayed, correct to the nearest minute.
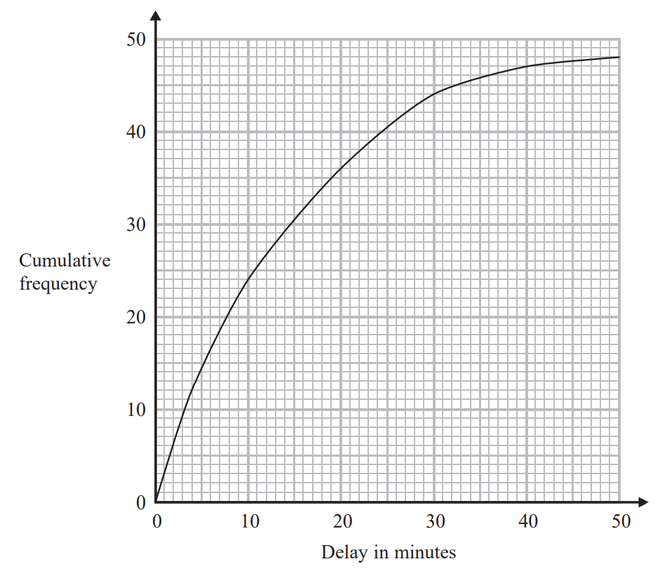
The shortest delay was 0 minutes.
The longest delay was 42 minutes.
(a) On the grid below, draw a box plot for the information about the delays on Monday
The longest delay was 42 minutes.
(a) On the grid below, draw a box plot for the information about the delays on Monday
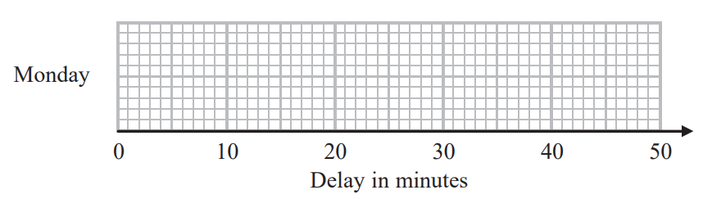
[3 marks]
48 trains left the station on Tuesday.
The box plot below gives information about the delays on Tuesday.
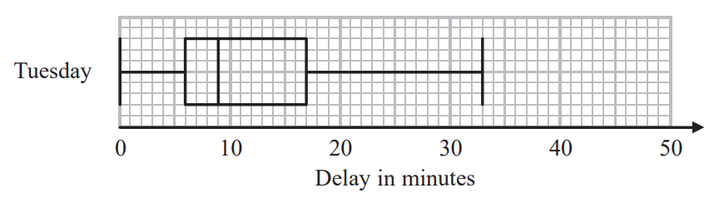
(b) Compare the distribution of the delays on Monday with the distribution of the delays on Tuesday.
[2 marks]
Mary says,
“ The longest delay on Tuesday was 33 minutes. This means that there must be some delays of between 25 minutes and 30 minutes.”
(c) Is Mary right? You must give a reason for your answer.
[1 mark]