Back to AQA Maths Foundation November 2018 Paper 3 Home
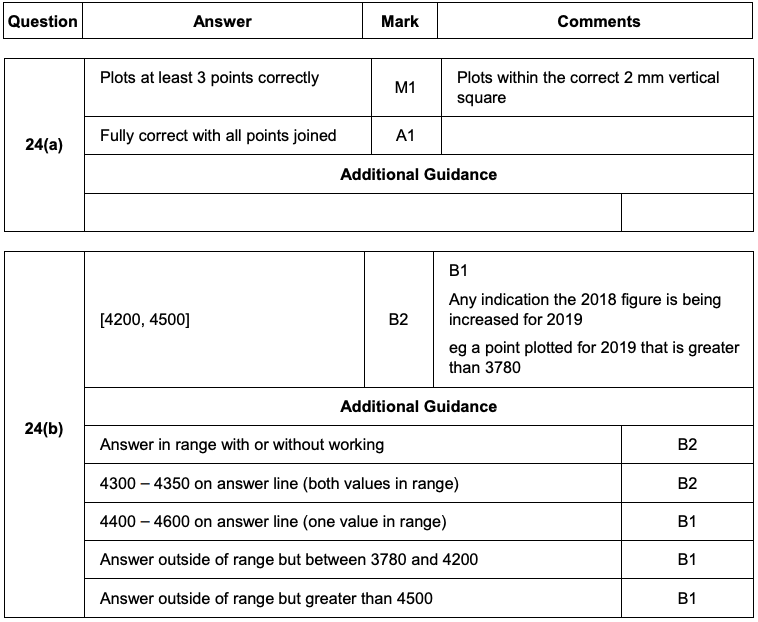
Q24: Answers – Paper 3 – November 2018
Q24: Answers – Paper 3 – November 2018
Mark Scheme
Working
A music festival has taken place each year from 2011
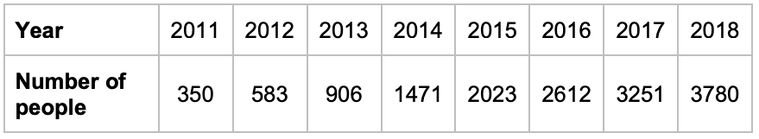
The table shows the number of people who attended each year.
a) Complete the graph.
A music festival has taken place each year from 2011
The table shows the number of people who attended each year.
a) Complete the graph.

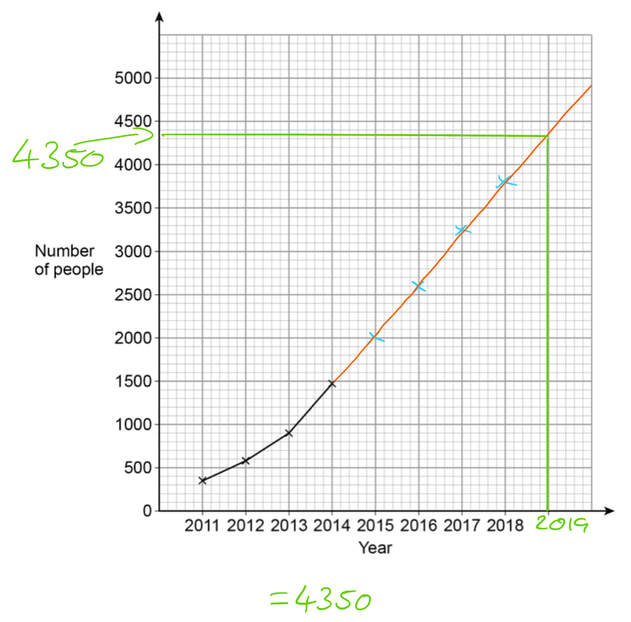
b) Use the graph to estimate the number of people who will attend the festival in 2019
Question
Click here for a printable PDF of this question.
24)
A music festival has taken place each year from 2011
The table shows the number of people who attended each year.
24)
A music festival has taken place each year from 2011
The table shows the number of people who attended each year.
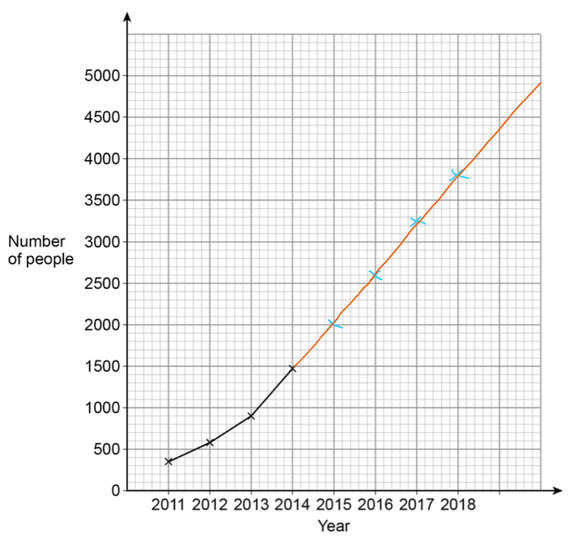
The festival organisers draw a time series graph to represent the data.
The first four years have been plotted.
The first four years have been plotted.
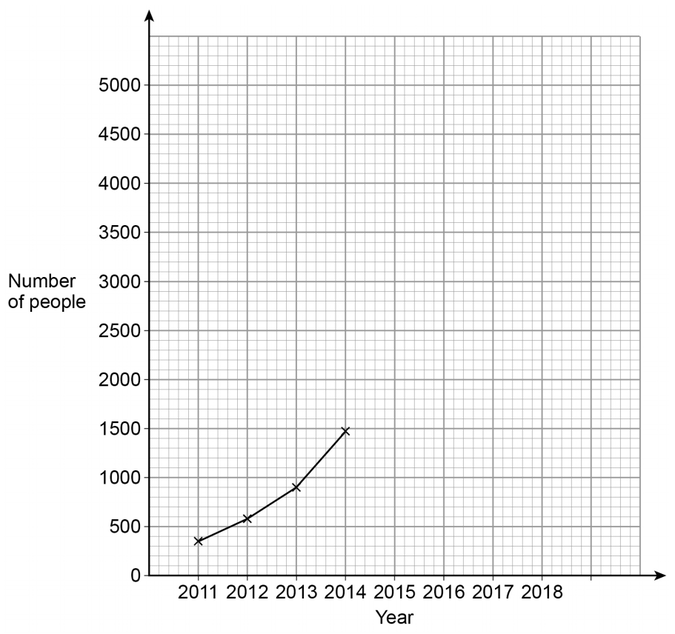
a) Complete the graph.
[2 marks]
b) Use the graph to estimate the number of people who will attend the festival in 2019
[2 marks]