Back to AQA Maths Foundation June 2018 Paper 2 Home
Q15: Answers – Paper 2 – June 2018
Q15: Answers – Paper 2 – June 2018
Helpful Links
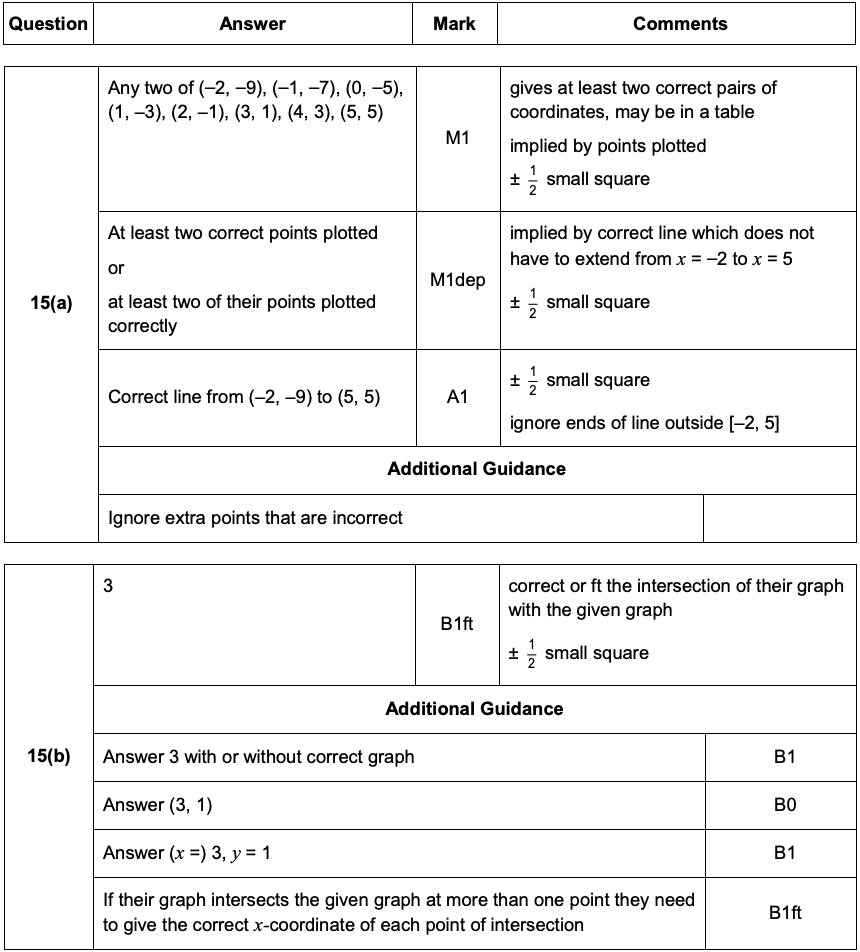
Mark Scheme
Working
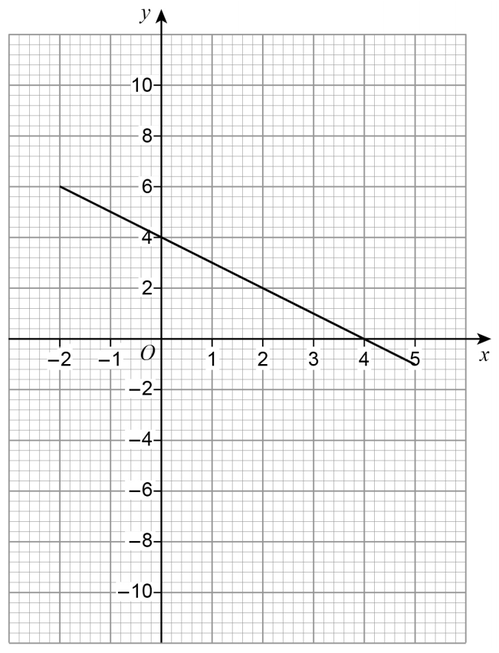
The graph of y = 4 – x for values of x from –2 to 5 is shown on the grid.
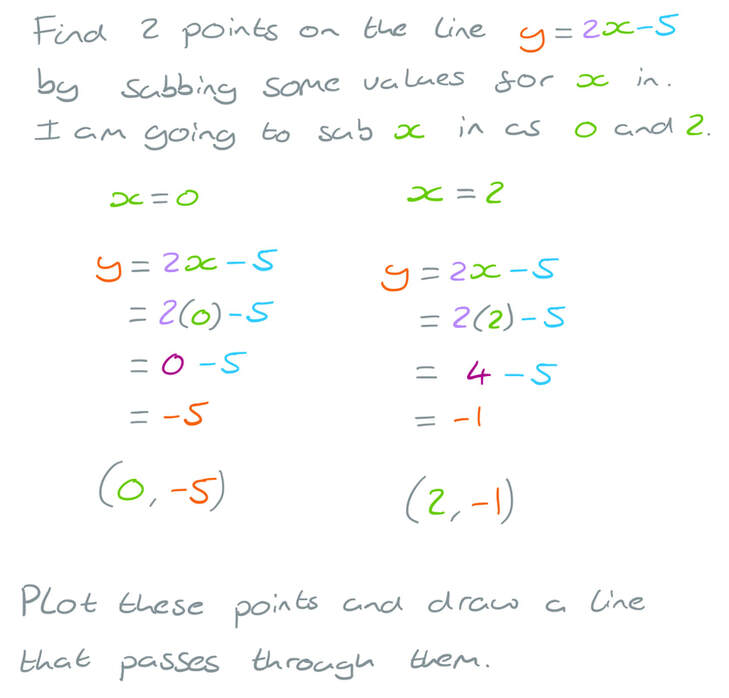
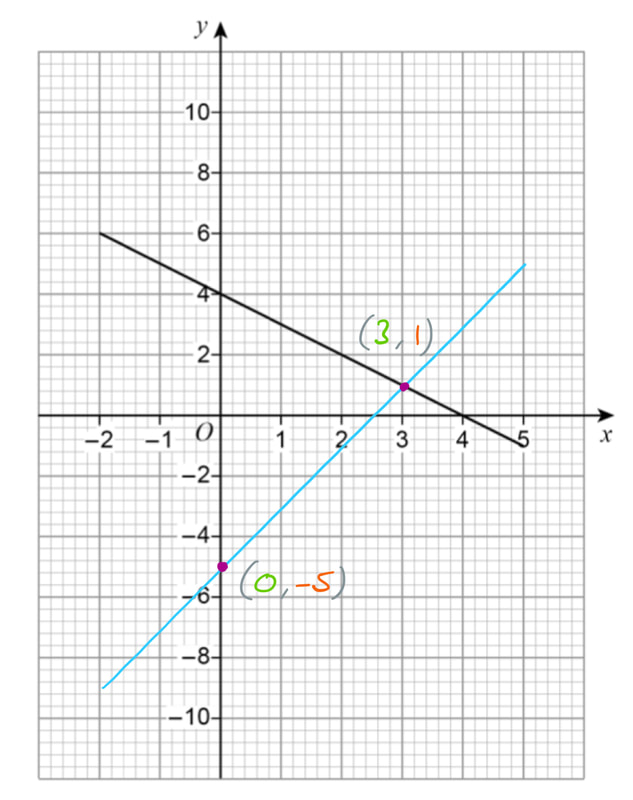
a) On the grid, draw the graph of y = 2x – 5 for values of x from –2 to 5
The graph of y = 4 – x for values of x from –2 to 5 is shown on the grid.
a) On the grid, draw the graph of y = 2x – 5 for values of x from –2 to 5
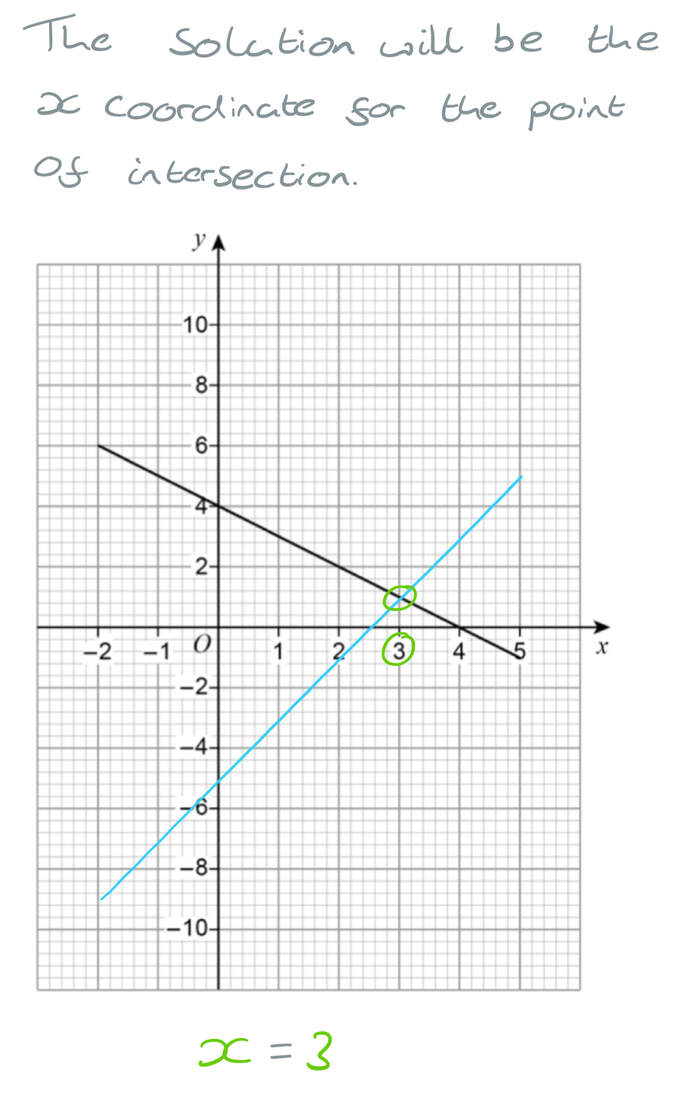
b) Use your graph to solve 2x – 5 = 4 – x
Question
Click here for a printable PDF of this question.
15)
The graph of y = 4 – x for values of x from –2 to 5 is shown on the grid.
a) On the grid, draw the graph of y = 2x – 5 for values of x from –2 to 5
15)
The graph of y = 4 – x for values of x from –2 to 5 is shown on the grid.
a) On the grid, draw the graph of y = 2x – 5 for values of x from –2 to 5
[3 marks]
b) Use your graph to solve 2x – 5 = 4 – x
x = ___________________
[1 mark]