Back to AQA Maths Foundation November 2017 Paper 1 Home
Q30: Question – Paper 1 – November 2017
Q30: Question – Paper 1 – November 2017
Helpful Links
|
Content:
|
Question
Click here for a printable PDF of this question.
30)
The four candidates in an election were A, B, C and D.
The pie chart shows the proportion of votes for each candidate.
30)
The four candidates in an election were A, B, C and D.
The pie chart shows the proportion of votes for each candidate.
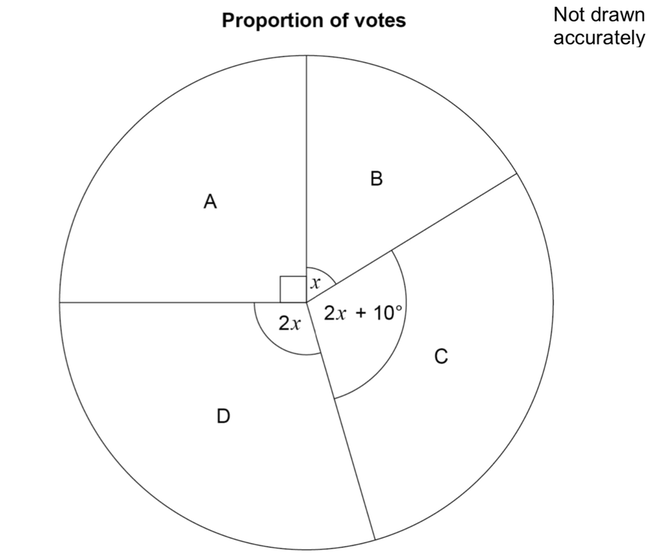
Work out the probability that a person who voted, chosen at random, voted for C.
[4 marks]