Elevise
  • Home
  • GCSE Maths
  • GCSE Science
  • Membership
Back to AQA Maths Foundation November 2018 Paper 1 Home
​Q22: Question – Paper 1 – November 2018
Helpful Links
Content:
  • Plotting Quadratic Functions
  • Estimating Values from Quadratic Curves​
Quizzes:
  • Plotting Quadratic Functions
  • Estimating Values from Quadratic Curves

Question
Click here for a printable PDF of this question.
22) 

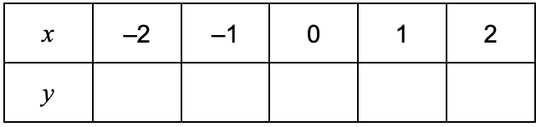
a) Complete the table of values for        y = x2

[1 mark]​​
Picture

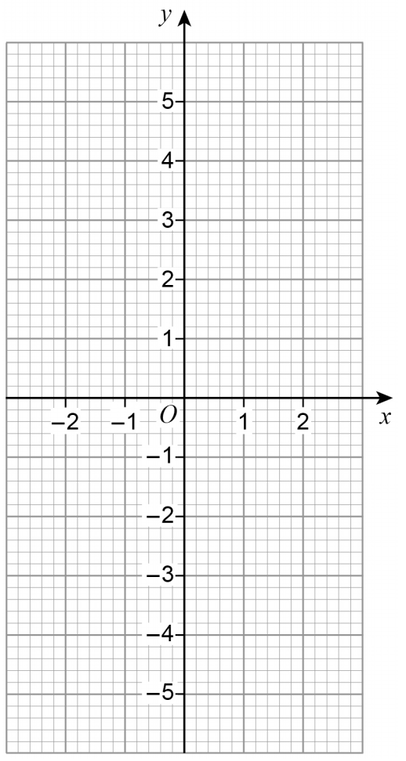
b) Draw the graph of      y = x2      for values of x from –2 to 2

[2 marks]​​
Picture

c) Use your graph to estimate the value of
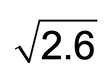
Picture
[2 marks]​​
Show answers
Home
GCSE Maths
GCSE Science
Membership
Tuition
United Kingdom
[email protected]
  • Home
  • GCSE Maths
  • GCSE Science
  • Membership