Back to Edexcel Maths Higher November 2018 Paper 3 Home
Q4: Question – Paper 3 – November 2018
Q4: Question – Paper 3 – November 2018
Helpful Links
Question
Click here for a printable PDF of this question.
4)
Fran asks each of 40 students how many books they bought last year.
The chart below shows information about the number of books bought by each of the 40 students.
4)
Fran asks each of 40 students how many books they bought last year.
The chart below shows information about the number of books bought by each of the 40 students.
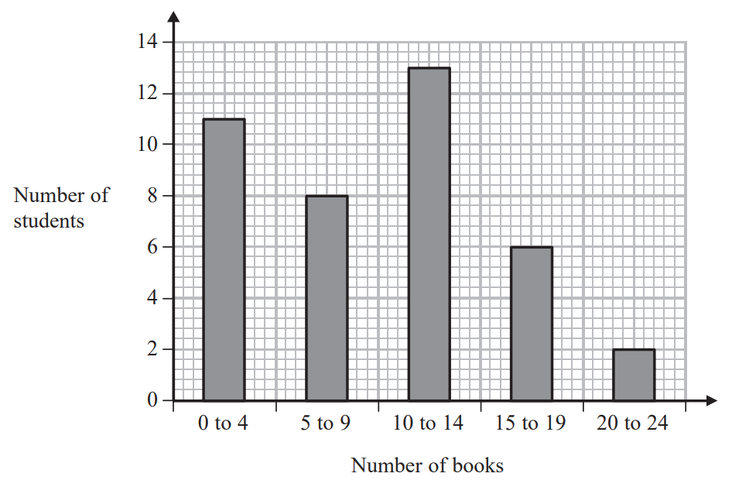
a) Work out the percentage of these students who bought 20 or more books.
[2 marks]
b) Show that an estimate for the mean number of books bought is 9.5
You must show all your working.
[4 marks]