Back to Edexcel Maths Higher June 2018 Paper 2 Home
Q14: Question – Paper 2 – June 2018
Q14: Question – Paper 2 – June 2018
Helpful Links
Question
Click here for a printable PDF version of this question.
14)
The distance-time graph shows information about part of a car journey.
14)
The distance-time graph shows information about part of a car journey.
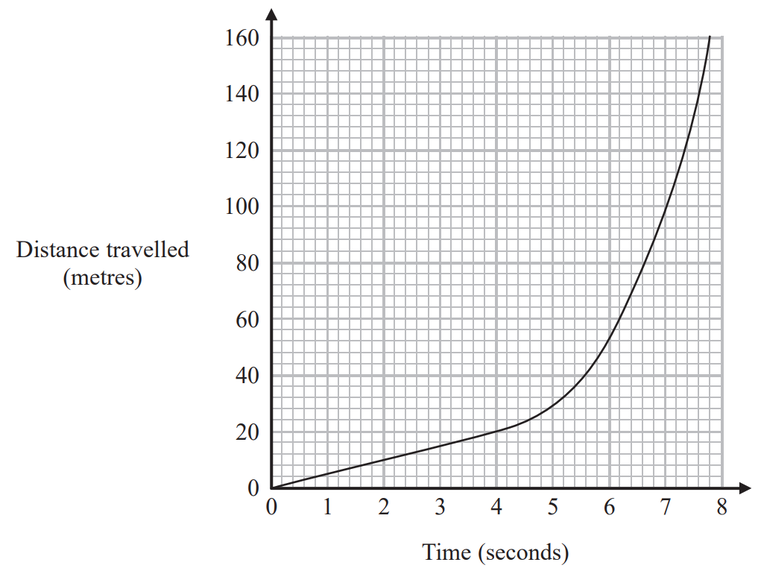
Use the graph to estimate the speed of the car at time 5 seconds.
[3 marks]