
Back to Edexcel Maths Higher June 2018 Paper 2 Home
Q17: Answers – Paper 2 – June 2018
Q17: Answers – Paper 2 – June 2018
Helpful Links
|
Content:
|
Mark Scheme
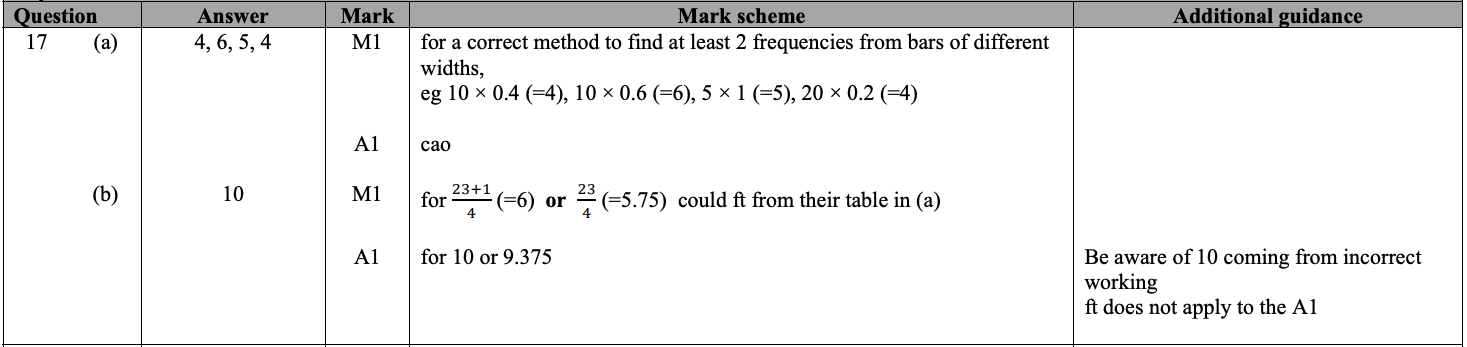
Working
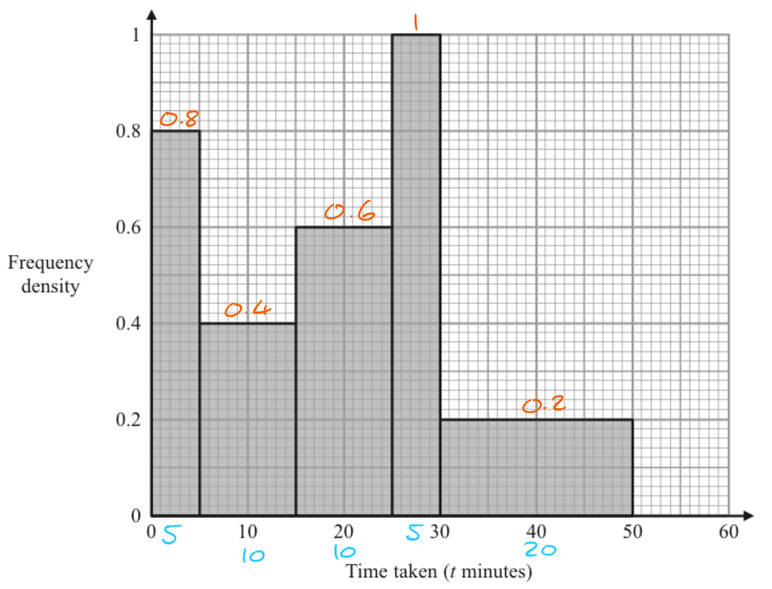
The histogram shows information about the times taken by some students to finish a puzzle.
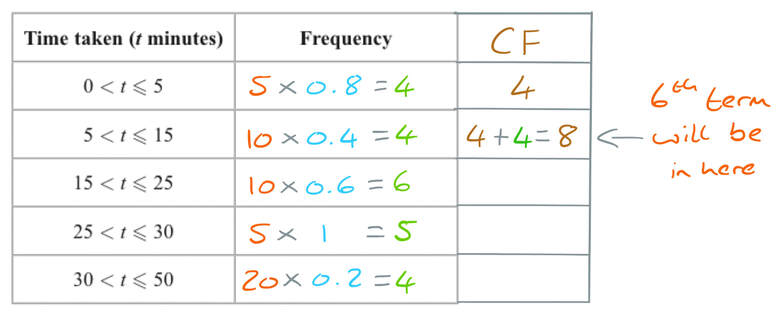
a) Complete the frequency table for this information.
The histogram shows information about the times taken by some students to finish a puzzle.
a) Complete the frequency table for this information.

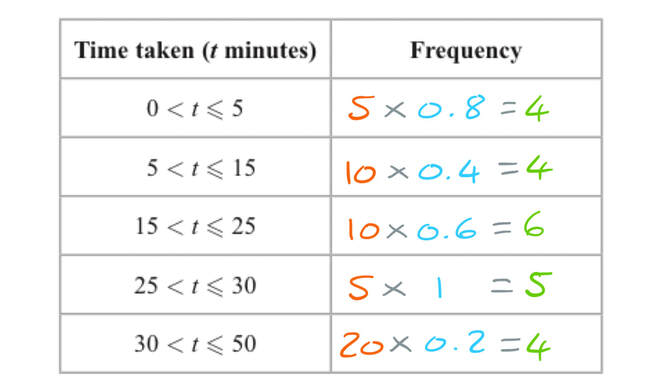
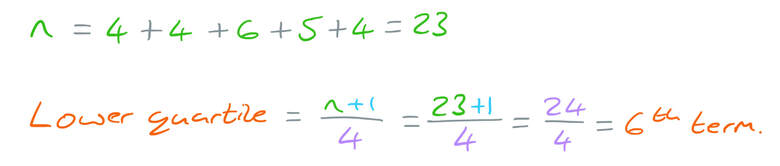
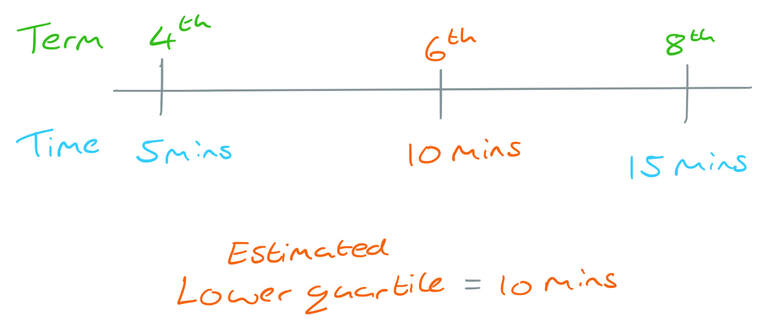
b) Find an estimate for the lower quartile of the times taken to finish the puzzle.
Question
Click here for a printable PDF of this question.
17) The histogram shows information about the times taken by some students to finish a puzzle.
17) The histogram shows information about the times taken by some students to finish a puzzle.
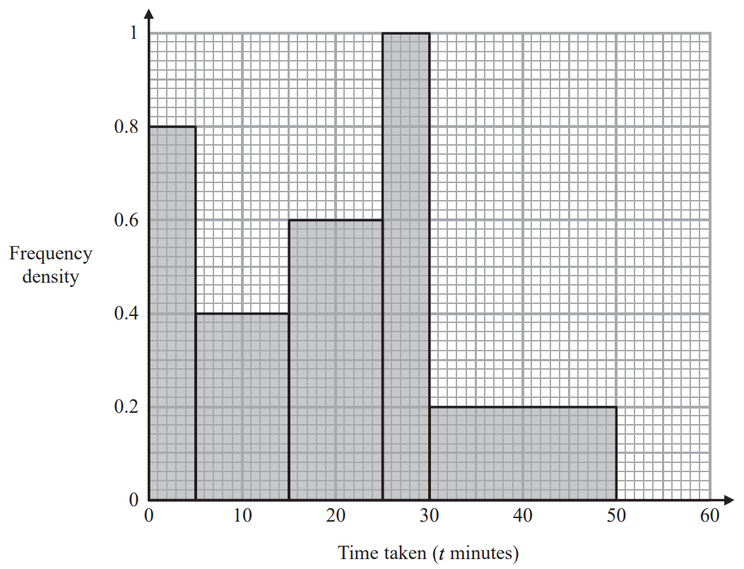
a) Complete the frequency table for this information.
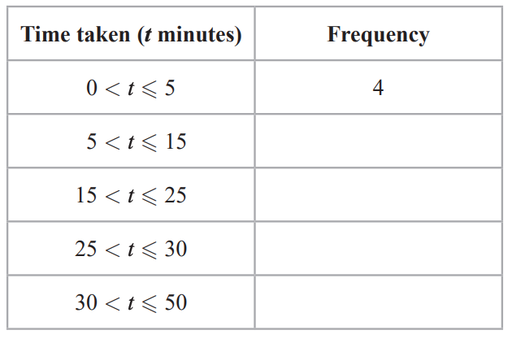
[2 marks]
b) Find an estimate for the lower quartile of the times taken to finish the puzzle.
[2 marks]