Back to Edexcel Maths Higher June 2018 Paper 2 Home
Q5: Question – Paper 2 – June 2018
Q5: Question – Paper 2 – June 2018
Helpful Links
Question
Click here for a printable PDF for this question.
5)
5)
a) Complete the table of values for y = x2 – x – 6
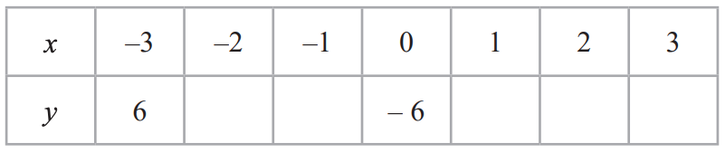
[2 marks]
b) On the grid, draw the graph of y = x2 – x – 6 for values of x from -3 to 3.
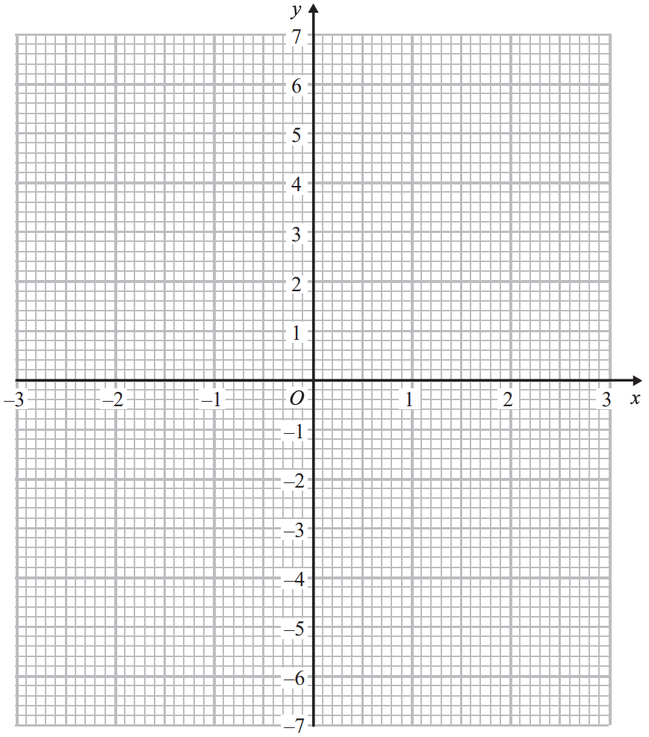
[2 marks]
c) Use your graph to find estimates of the solutions to the equation x2 – x – 6 = -2
[2 marks]