Back to Edexcel Maths Higher June 2018 Paper 3 Home
Q12: Question – Paper 3 – June 2018
Q12: Question – Paper 3 – June 2018
Helpful Links
Question
Click here for a printable PDF of this question.
12)
The graph shows the volume of liquid (L litres) in a container at time t seconds.
12)
The graph shows the volume of liquid (L litres) in a container at time t seconds.
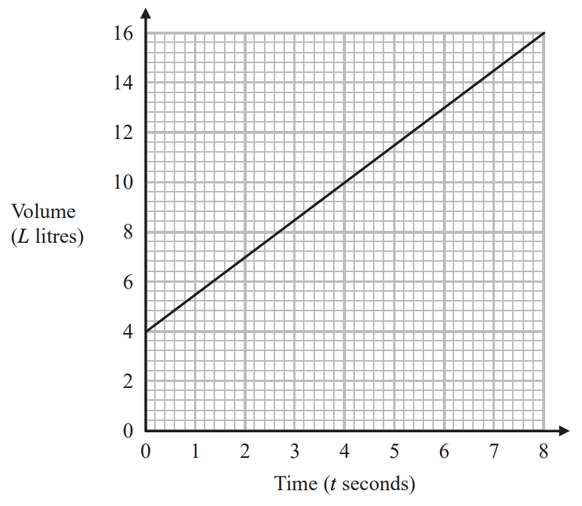
a) Find the gradient of the graph.
[2 marks]
b) Explain what this gradient represents.
[1 mark]
The graph intersects the volume axis at L = 4
c) Explain what this intercept represents.
[1 mark]