Back to Edexcel Maths Higher June 2018 Paper 3 Home
Q15: Question – Paper 3 – June 2018
Helpful Links
Content:
Q15: Question – Paper 3 – June 2018
Helpful Links
Content:
Question
Click here for a printable PDF of this question.
15)
The graph shows the speed of a car, in metres per second, during the first 20 seconds of a journey.
15)
The graph shows the speed of a car, in metres per second, during the first 20 seconds of a journey.
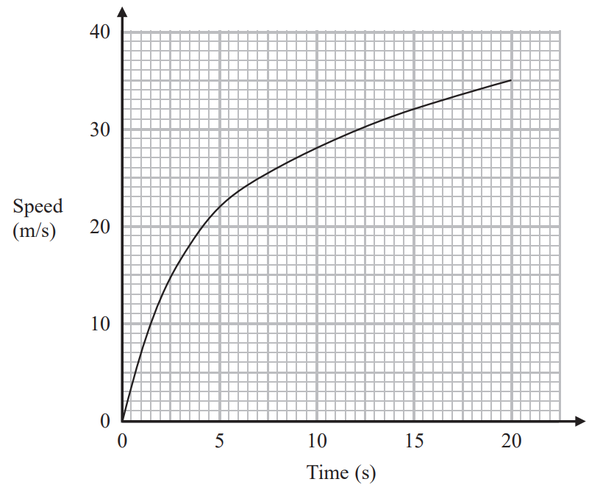
a) Work out an estimate for the distance the car travelled in the first 20 seconds.
Use 4 strips of equal width.
Use 4 strips of equal width.
[3 marks]
b) Is your answer to part (a) an underestimate or an overestimate of the actual distance the car travelled in the first 20 seconds?
Give a reason for your answer.
[1 mark]