Back to Edexcel Maths Higher November 2017 Paper 1 Home
Q12: Question – Paper 1 – November 2017
Q12: Question – Paper 1 – November 2017
Helpful Links
|
Content:
|
Question
Click here for a printable PDF of this question.
12)
The table shows information about the heights, in cm, of a group of Year 11 girls.
12)
The table shows information about the heights, in cm, of a group of Year 11 girls.
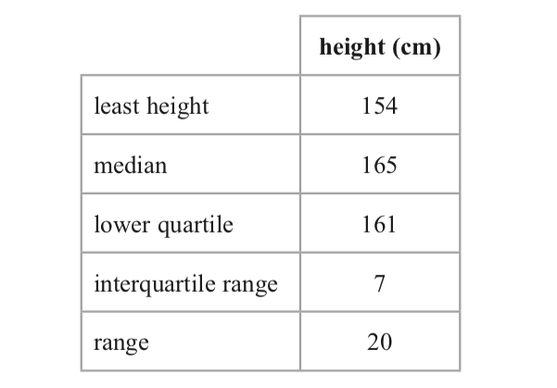
a) Draw a box plot for this information.
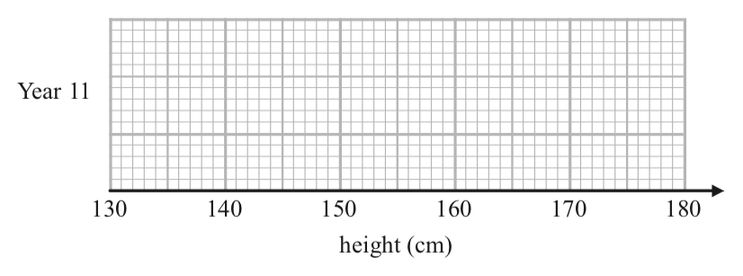
[3 marks]
The box plot below shows information about the heights, in cm, of a group of Year 7 girls.
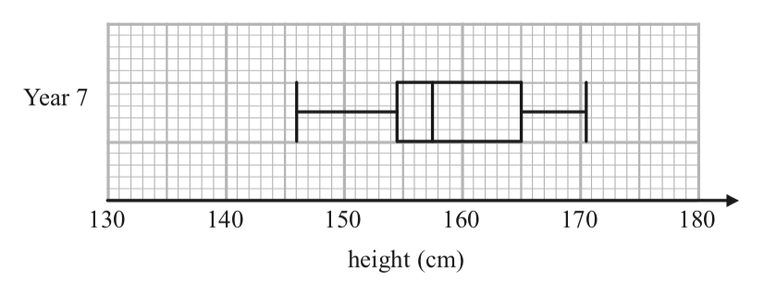
b) Compare the distribution of heights of the Year 7 girls with the distribution of heights of the Year 11 girls.
[2 marks]