Back to Edexcel Maths Higher November 2017 Paper 2 Home
Q17: Question – Paper 2 – November 2017
Q17: Question – Paper 2 – November 2017
Helpful Links
|
Quizzes:
|
Question
Click here for a printable version of this question.
17)
The table gives information about the heights of 150 students.
17)
The table gives information about the heights of 150 students.
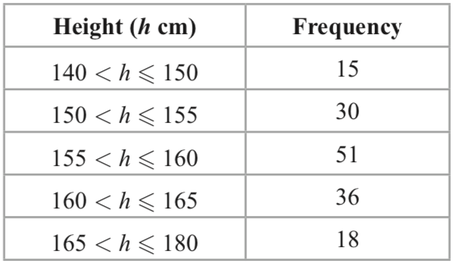
a) On the grid, draw a histogram for this information.
[3 marks]
b) Work out an estimate for the fraction of the students who have a height between 150 cm and 170 cm.
[2 marks]