Back to Edexcel Maths Higher June 2017 Paper 2 Home
Q20: Question – Paper 2 – June 2017
Q20: Question – Paper 2 – June 2017
Helpful Links
Question
Click here for a printable version of this question.
20)
20)
The diagram shows part of the graph of y = x2 – 2x + 3
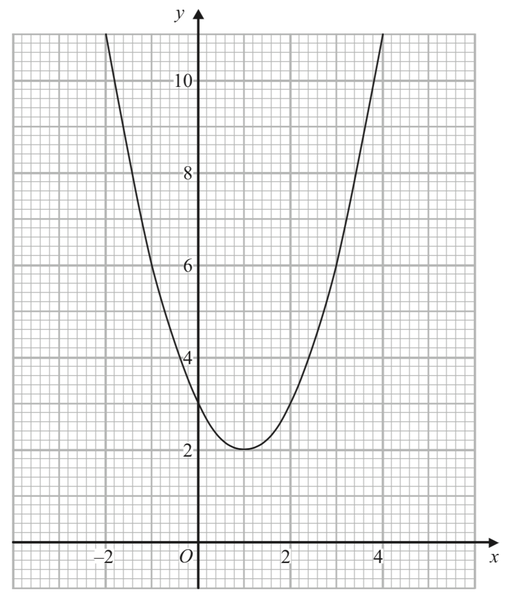
a) By drawing a suitable straight line, use your graph to find estimates for the solutions of x2 – 3x – 1 = 0
[2 marks]
P is the point on the graph of y = x2 – 2x + 3 where x = 2
b) Calculate an estimate for the gradient of the graph at the point P.
[3 marks]