Back to Edexcel Maths Foundation June 2018 Paper 3 Home
Q19: Answers – Paper 3 – June 2018
Q19: Answers – Paper 3 – June 2018
Helpful Links
|
Content:
|
Mark Scheme
|
There is no working for this question!
|
|
Question
Click here for a printable PDF of this question.
19)
The scatter diagram shows information about 12 girls.
It shows the age of each girl and the best time she takes to run 100 metres.
19)
The scatter diagram shows information about 12 girls.
It shows the age of each girl and the best time she takes to run 100 metres.
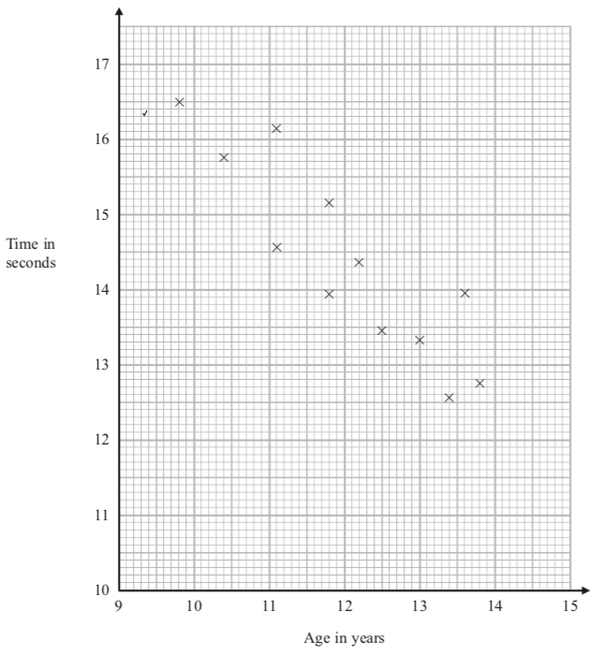
a) Write down the type of correlation.
[1 mark]
Kristina is 11 years old.
Her best time to run 100 metres is 12 seconds.
The point representing this information would be an outlier on the scatter diagram.
b) Explain why.
[1 mark]
Debbie is 15 years old.
Debbie says,
“The scatter diagram shows I should take less than 12 seconds to run 100 metres.”
c) Comment on what Debbie says.
[1 mark]