
Back to Edexcel Maths Foundation November 2018 Paper 2 Home
Q21: Question – Paper 2 – November 2018
Q21: Question – Paper 2 – November 2018
Helpful Links
|
Content:
|
Question
Click here for a printable PDF of this question.
21)
Sean has information about the height, in cm, and the weight, in kg, of each of ten rugby players.
He is asked to draw a scatter graph and a line of best fit for this information.
Here is his answer.
21)
Sean has information about the height, in cm, and the weight, in kg, of each of ten rugby players.
He is asked to draw a scatter graph and a line of best fit for this information.
Here is his answer.
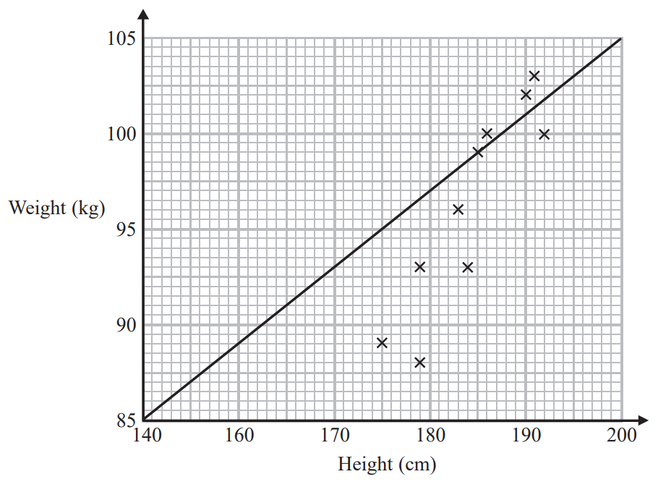
Sean has plotted the points accurately.
Write down two things that are wrong with his answer.
Write down two things that are wrong with his answer.
[2 marks]