Back to Edexcel Maths Foundation November 2017 Paper 2 Home
Q8: Question – Paper 2 – November 2017
Q8: Question – Paper 2 – November 2017
Question
8) Chrissy drew this graph to show the percentage of buses that got to a bus stop on time for six months.
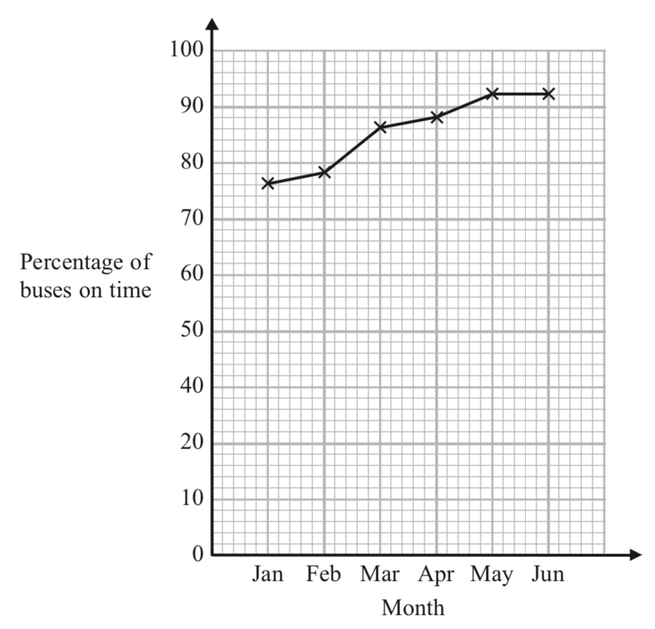
a) Write down one thing that is wrong with the graph.
[1 mark]
b) Describe the trend in the percentage of buses that got to the bus stop on time.
[1 mark]