Back to OCR Maths Higher November 2018 Paper 4 Home
Q15: Question – Paper 4 – November 2018
Q15: Question – Paper 4 – November 2018
Helpful Links
Question
15) The box plot shows the distribution of the runs scored by David in some cricket matches.
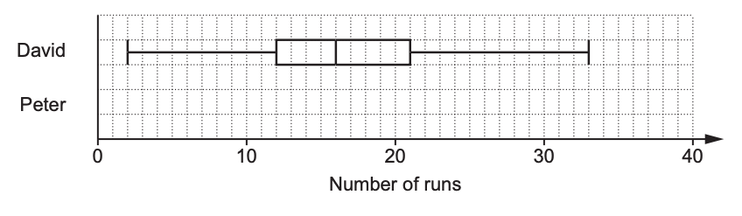
a) Another player, Peter, has
Show the distribution of Peter’s scores as a box plot on the diagram above.
- a median score of 26
- a highest score of 39
- a lowest score of 8
- a lower quartile of 14
- an inter-quartile range of 18.
Show the distribution of Peter’s scores as a box plot on the diagram above.
[2 marks]
b) Decide whether David or Peter best satisfies each of these questions.
Give a reason for each of your decisions.
i) Who scored more runs on average?
............................ because ...............................................................................................
[1 mark]
ii) Whose scores were more consistent?
............................ because ...............................................................................................
[1 mark]