Back to OCR Maths Higher November 2018 Paper 5 Home
Q15: Answers – Paper 5 – November 2018
Q15: Answers – Paper 5 – November 2018
Helpful Links
Mark Scheme

Working
Question
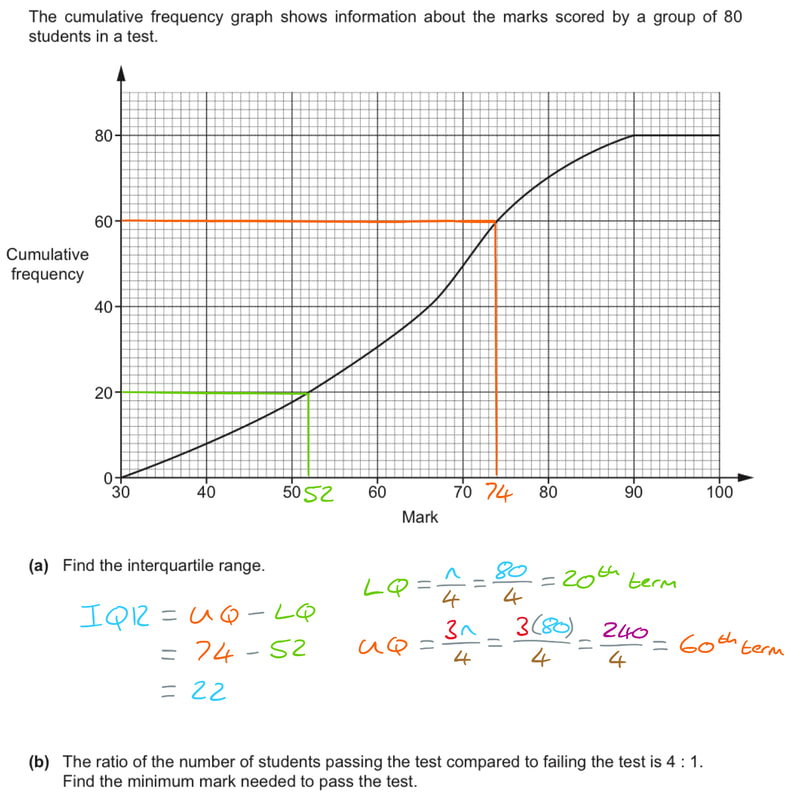
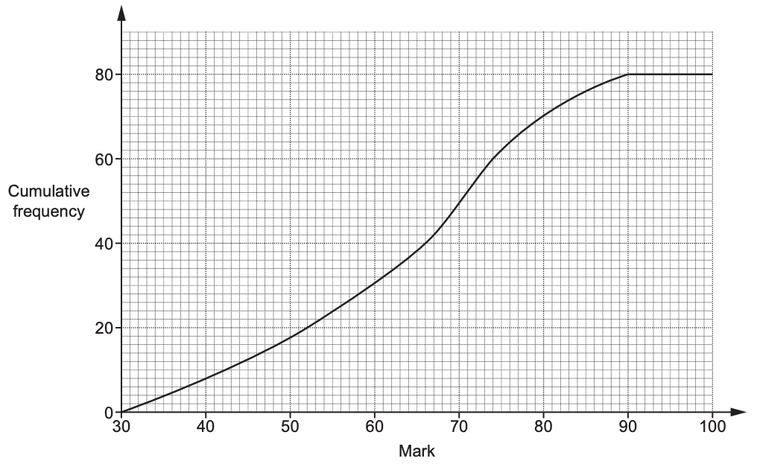
15) The cumulative frequency graph shows information about the marks scored by a group of 80 students in a test.
a) Find the interquartile range.
[2 marks]
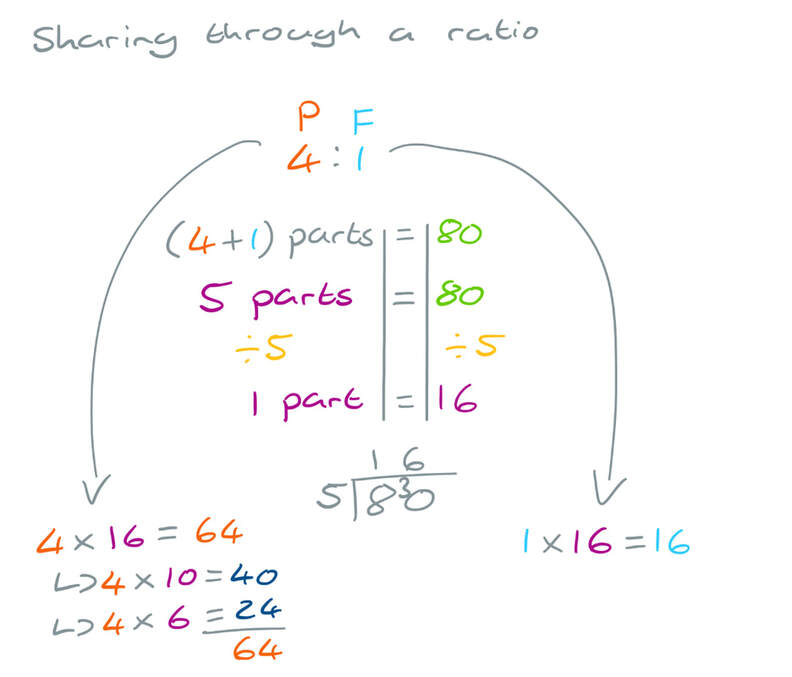
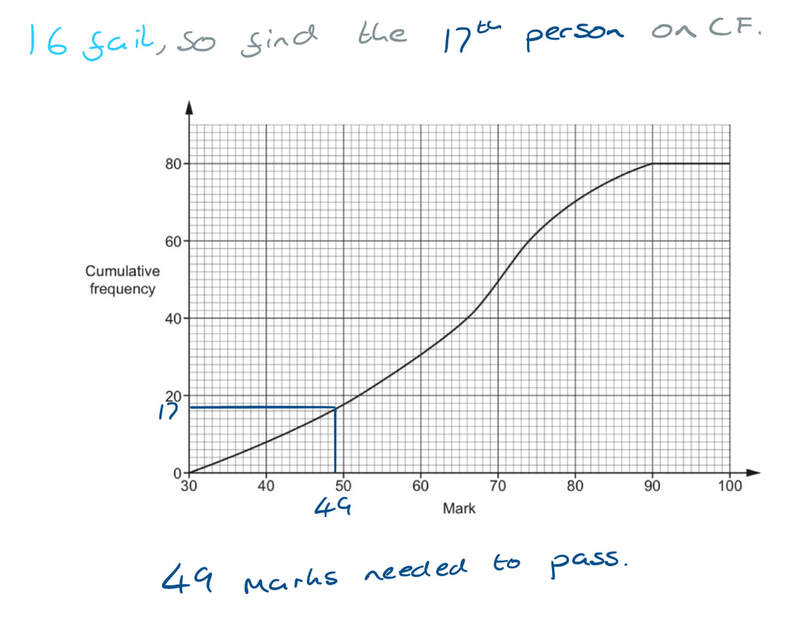
b) The ratio of the number of students passing the test compared to failing the test is 4 : 1.
Find the minimum mark needed to pass the test.
[3 marks]