Back to OCR Maths Higher November 2018 Paper 6 Home
Q8: Question – Paper 6 – November 2018
Q8: Question – Paper 6 – November 2018
Helpful Links
Question
8) The graph shows the speed of a cyclist during 20 seconds of a journey.
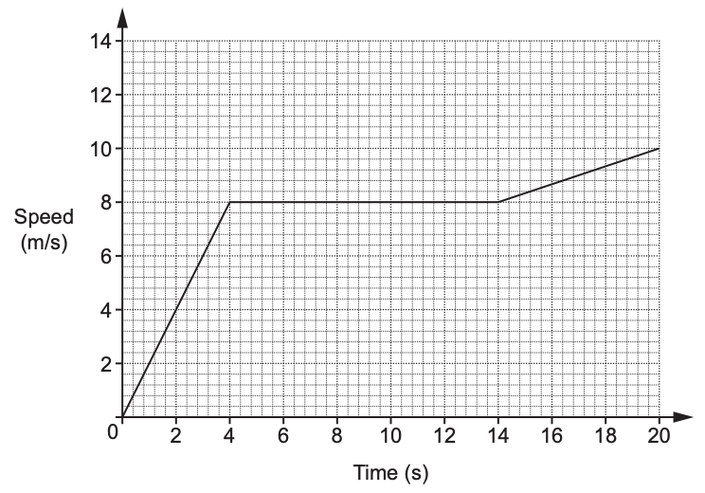
a) Find the acceleration of the cyclist
i) for the first 4 seconds
...............................................m/s2
[2 marks]
ii) between 4 seconds and 14 seconds.
...............................................m/s2
[1 mark]
b) Work out the distance travelled by the cyclist during the 20 seconds.
................................................... m
[4 marks]