Back to OCR Maths Higher November 2018 Paper 6 Home
Q9: Question – Paper 6 – November 2018
Q9: Question – Paper 6 – November 2018
Helpful Links
|
Content:
|
Question
9) These graphs show different relationships between the variables x and y.
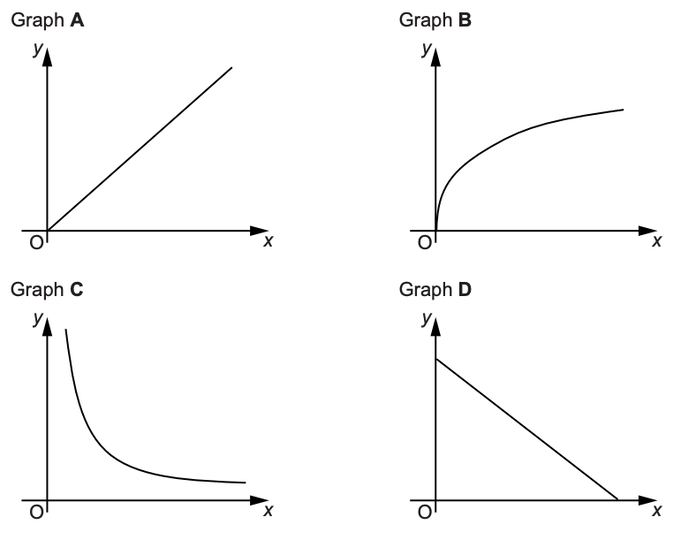
Identify the graph which shows the following.
a) y is directly proportional to x.
a) y is directly proportional to x.
Graph ...........................
[1 mark]
[1 mark]
b) y is inversely proportional to x.
Graph ...........................
[1 mark]
[1 mark]