Back to OCR Maths Higher June 2018 Paper 4 Home
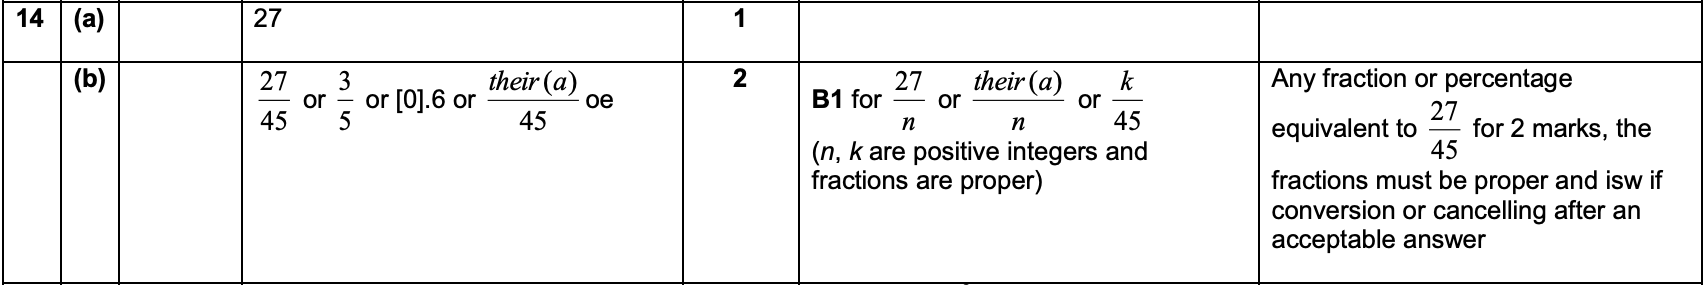
Q14: Answers – Paper 4 – June 2018
Q14: Answers – Paper 4 – June 2018
Helpful Links
Mark Scheme
Working
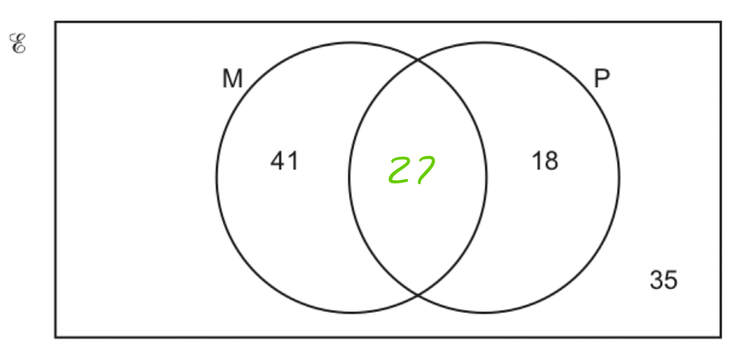
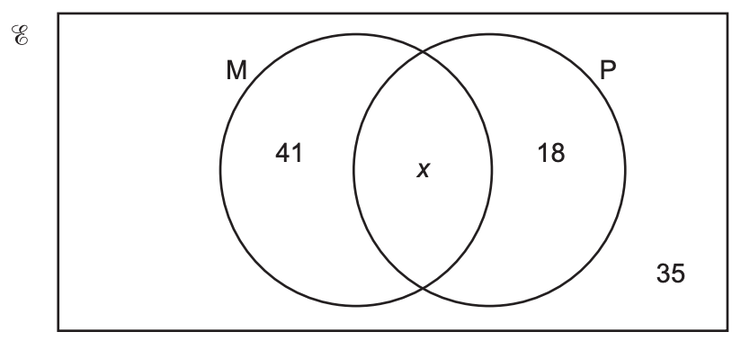
The Venn diagram shows the number of students studying Mathematics (M) and the number of students studying Physics (P) in a college.
35 students do not study either subject.
The Venn diagram shows the number of students studying Mathematics (M) and the number of students studying Physics (P) in a college.
35 students do not study either subject.

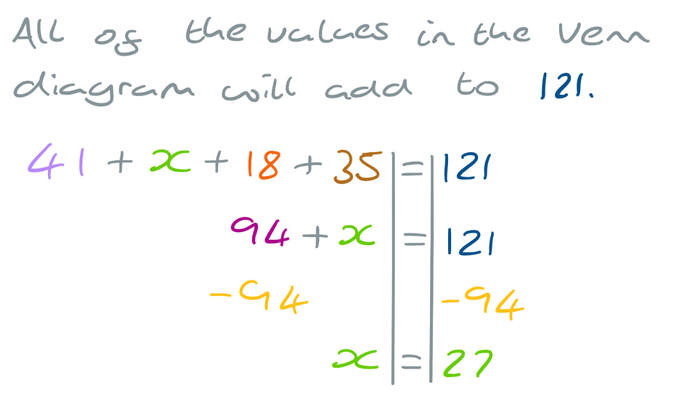
a) The total number of students is 121.
Find the value of x.
Find the value of x.
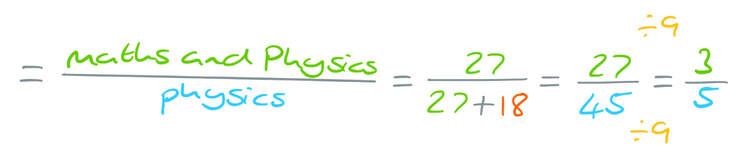
b) One of the 121 students is selected at random.
Find the probability that this student studies Mathematics, given that they study Physics.
Question
14) The Venn diagram shows the number of students studying Mathematics (M) and the number of students studying Physics (P) in a college.
35 students do not study either subject.
35 students do not study either subject.
a) The total number of students is 121.
Find the value of x.
Find the value of x.
[1 mark]
b) One of the 121 students is selected at random.
Find the probability that this student studies Mathematics, given that they study Physics.
[2 marks]