Back to OCR Maths Higher June 2018 Paper 4 Home
Q4: Question – Paper 4 – June 2018
Q4: Question – Paper 4 – June 2018
Helpful Links
|
Content:
|
Question
Click here for a printable PDF of this question.
4) Lee wishes to find out if there is a relationship between a person’s age and the time it takes them to complete a puzzle.
Lee decides to conduct an experiment.
She asks 12 people to complete the puzzle.
She records each person’s age and the time taken to complete the puzzle.
a) Make one criticism of Lee’s method.
[1 mark]
b) This scatter diagram shows the results for ten of the people in Lee’s experiment.
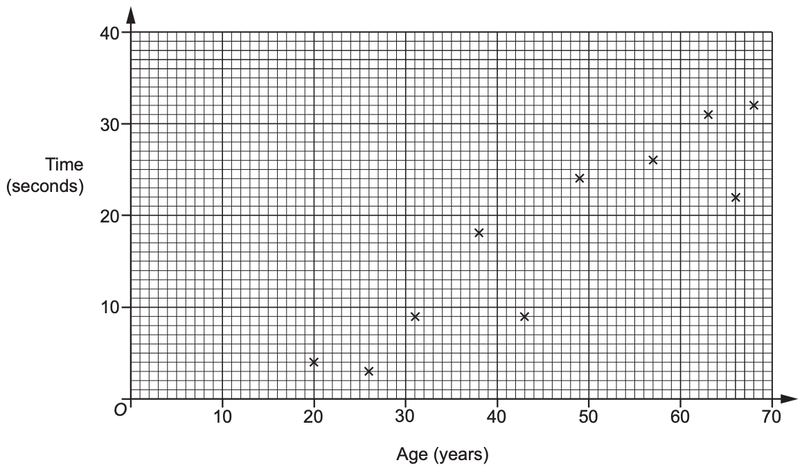
Here are the other two results.
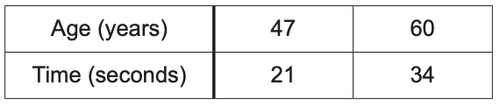
Plot these results on the scatter diagram.
[2 marks]
c) What type of correlation is shown in the scatter diagram?
[1 mark]
d) Estimate the time it would take a person aged 35 to complete the puzzle.
Show your working to justify your answer
[2 marks]
e) Lee says that at least 80% of the 12 people completed the puzzle in under 30 seconds.
Is Lee correct?
Show working to support your answer
[3 marks]