Back to OCR Maths Higher June 2018 Paper 5 Home
Q19: Question – Paper 5 – June 2018
Q19: Question – Paper 5 – June 2018
Helpful Links
Question
19) Ceri records the time taken, t minutes, to travel to school for a sample of 168 students at her Academy.
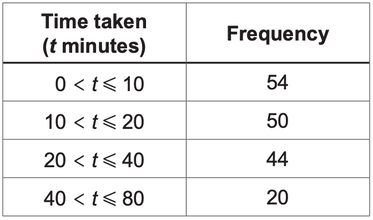
a) Draw a histogram to represent this information.
[4 marks]
b) Ceri says
"The longest time that any of these students took to travel to school was 80 minutes."
Is she correct?
Give a reason for your answer.
Give a reason for your answer.
[1 mark]
c) Ceri also claims that 25% of all of the students at this Academy took more than 30 minutes to travel to school.
i) Show how Ceri might have worked out her claim.
[2 marks]
ii) State one assumption that Ceri has made in making her claim.
[1 mark]