Back to OCR Maths Higher June 2018 Paper 6 Home
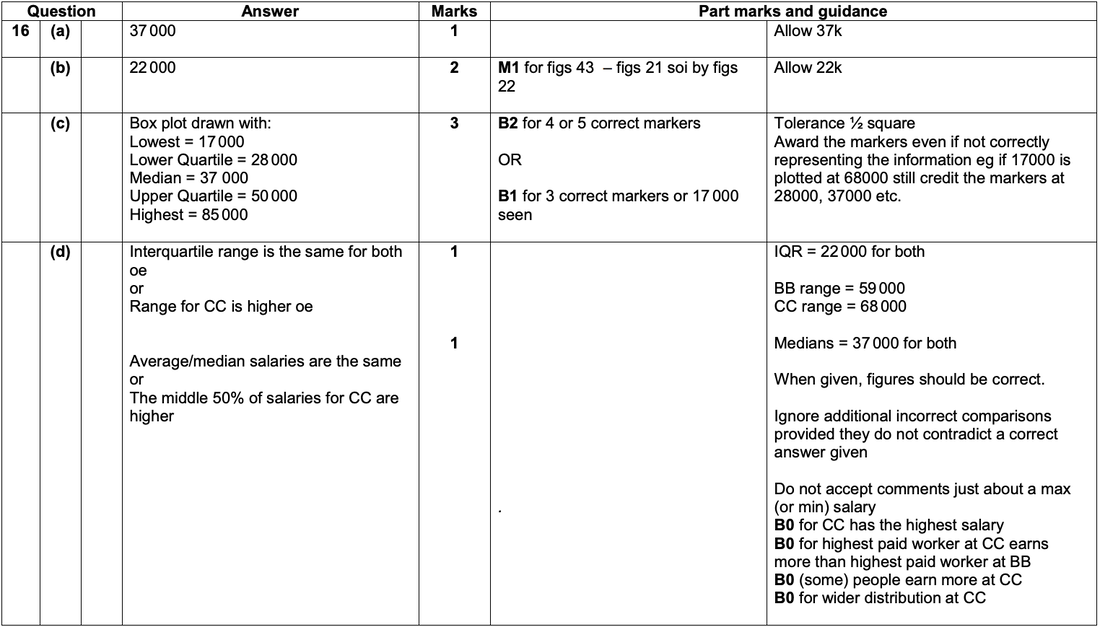
Q16: Answers – Paper 6 – June 2018
Q16: Answers – Paper 6 – June 2018
Helpful Links
Mark Scheme
Working
There is no working for part d!
Question
Click here for a printable PDF of this question.
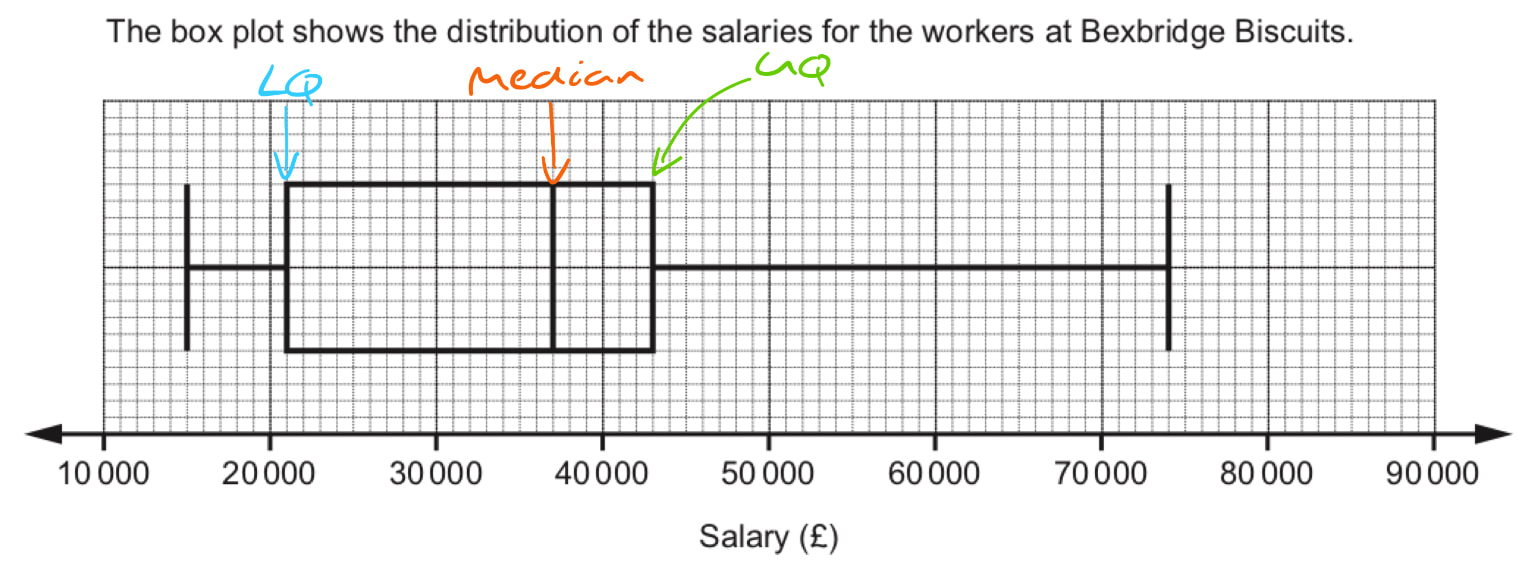
16) The box plot shows the distribution of the salaries for the workers at Bexbridge Biscuits.
16) The box plot shows the distribution of the salaries for the workers at Bexbridge Biscuits.
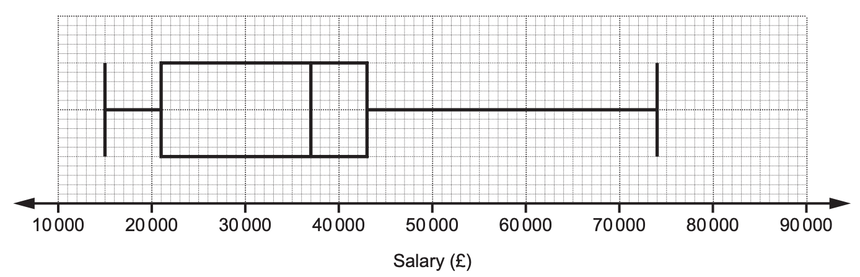
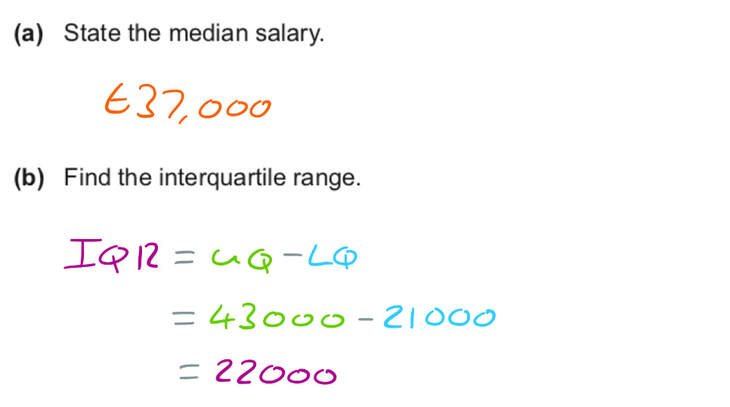
a) State the median salary.
[1 mark]
b) Find the interquartile range.
[2 marks]
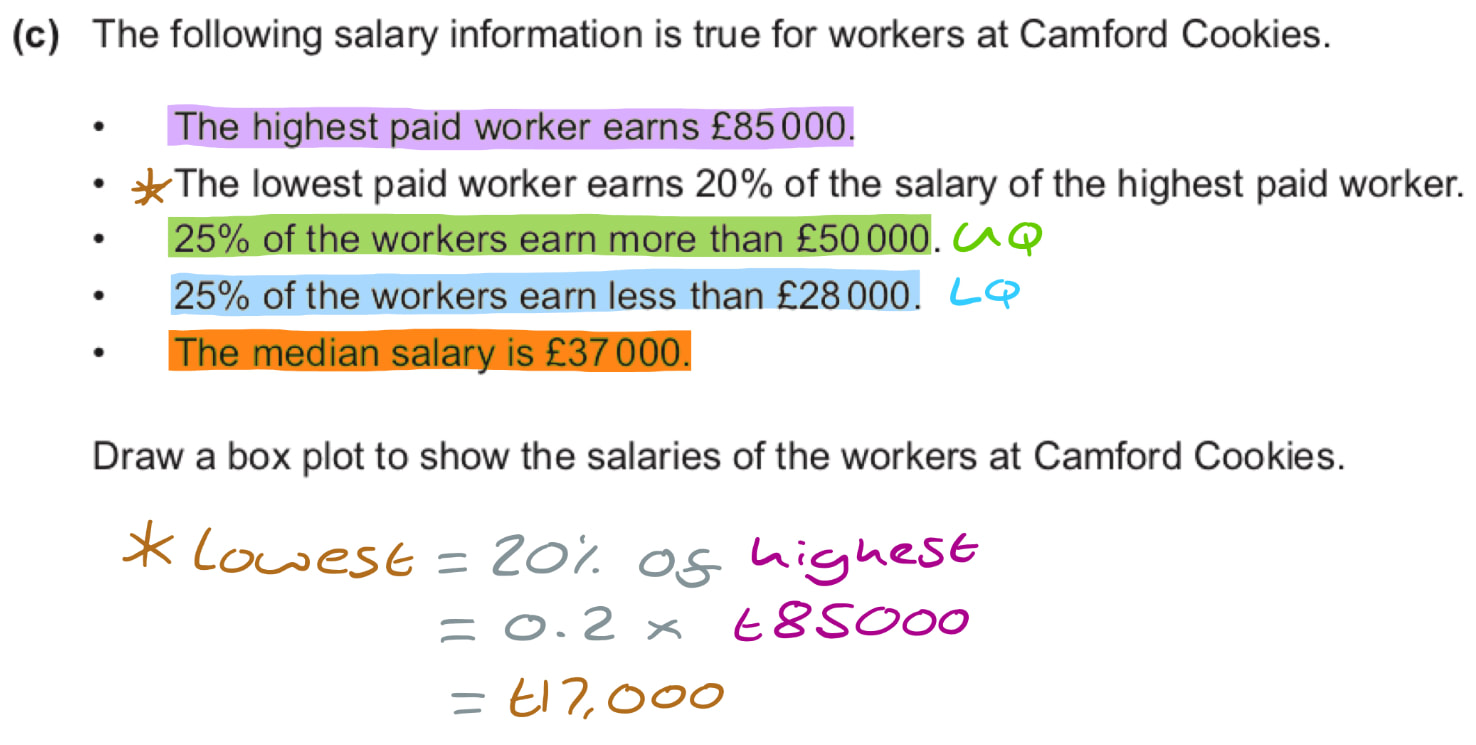
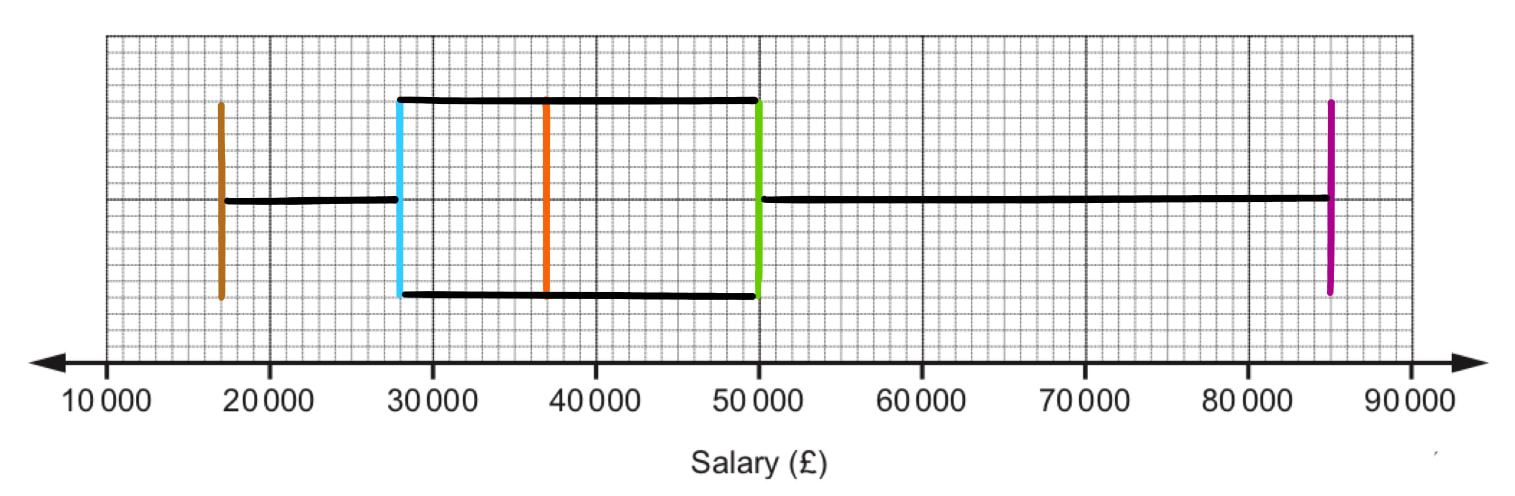
(c) The following salary information is true for workers at Camford Cookies.
- The highest paid worker earns £85000.
- The lowest paid worker earns 20% of the salary of the highest paid worker.
- 25% of the workers earn more than £50000.
- 25% of the workers earn less than £28000.
- The median salary is £37000.
Draw a box plot to show the salaries of the workers at Camford Cookies.

[3 marks]
d) Make two different comparisons between the distribution of the salaries at Bexbridge Biscuits and the salaries at Camford Cookies.
[2 marks]