Back to OCR Maths Foundation November 2018 Paper 2 Home
Q20: Question – Paper 2 – November 2018
Q20: Question – Paper 2 – November 2018
Helpful Links
|
Content:
|
Question
20) The table shows the number of computers sold in Tom’s shop each quarter from 2015 to 2017.
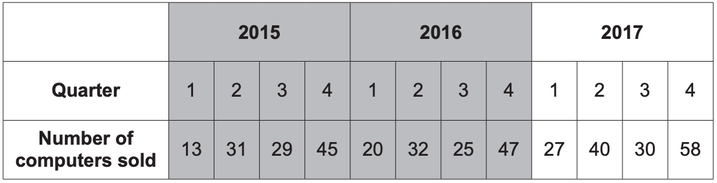
a) Complete this graph using the information for 2017.
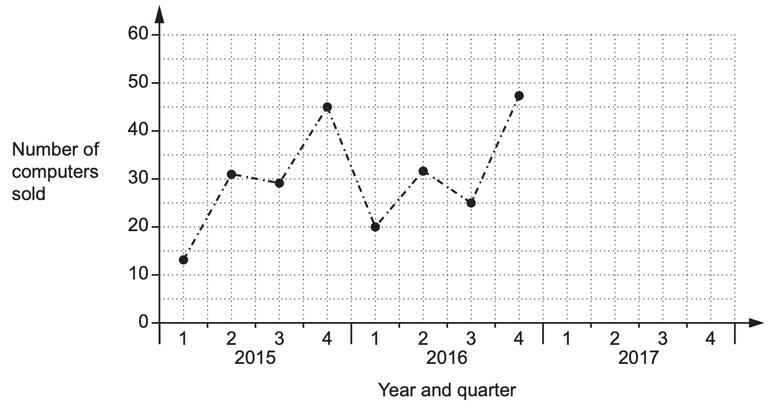
[2 marks]
b) Tom adds the three results for quarter 1 and he adds the three results for quarter 4.
Tom says
The ratio of the total number of computers sold in quarter 1 compared to quarter 4 is 2 : 5.
Is he correct?
Show your reasoning.
Show your reasoning.
[2 marks]
c) Make two comments about Tom’s sales over the period 2015 to 2017.
[2 marks]
d) Tom predicts that he will sell more than 60 computers in the 4th quarter of 2018.
What assumption has he made?
[1 mark]