2.1 AGGREGATE DEMAND
|
This video is relevant for this section despite it saying that it is for AQA.
|
|
Aggregate demand is the total amount of goods and services demanded by domestic and foreign households and firms.
|
Components of Aggregate Demand
Aggregate demand is made out of subcomponents and has the formula:
Aggregate demand is made out of subcomponents and has the formula:
AD = C + I + G + (X – M)
Whereby...
- C: Consumption, which is the level of consumer expenditure on goods and services. Consumption will include all goods and services. Levels of consumption tend to be fairly stable over the business cycle at around 60% and consumption is the largest component of GDP.
- I: Investment. Investment includes spending on capital goods, such as new machines and factories, and spending on working capital which are goods that are semi-finished or stocks that they are holding whilst waiting for a sale. In the UK, investment accounts for between 15-20% of GDP but is extremely volatile over the business cycle and this is known as the accelerator effect. An increase in the GDP growth rate will have a larger increase in the level of growth within investment. Alternatively, when GDP declines, investment levels will fall greater than the percentage fall in GDP. This is because firms are concerned about what the future may bring and focus their efforts on surviving the tough times rather than growing the business, therefore they cut their investment. Furthermore, investment tends to be a lagging indicator of the economy because it takes a while for firms to adjust. For example, when an economy experiences a down turn, firms will continue their level of production whilst orders for their goods and services drop off. This results in their stocks increasing. Then when conditions within the economy start to pick up firms will start to run down their stocks before starting production again. Investment comes from both the private and public sector, with around three quarters coming from private firms. Investment is a key component of AD as well as having an effect on the supply side. A high level of investment can increase the productive potential of the economy and hence allow the economy to experience economic growth.
- G: Government expenditure. Government expenditure accounts for around a fifth of GDP and is spending on state owned goods and services, such as health care and schools. Governments also spend money on transfer payments, which are payments to individuals who do not provide a good/ service in return. Transfer payment are not included in government spending, as they are just a transfer from one group to another.
- (X – M): this one is net exports. Net exports measure the value of exports (X) minus the value of imports (M). Exports are goods and services that are sold overseas and they are an injection to the circular flow of income. Imports are goods and services which are brought from abroad and these act as a leakage to the circular flow of income as money is leaving the system. A positive value for net exports means that an economy is exporting more than they are importing (a negative value is the reverse).
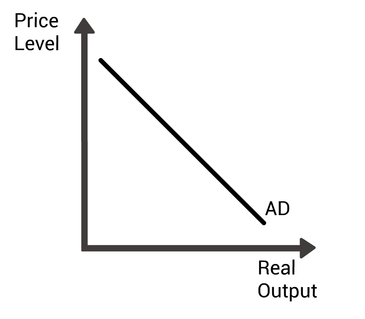 Aggregate demand plots price level against real output/ real GDP. It is downwards sloping.
Why does AD look like it does?
The aggregate demand curve plots the price level against real output/ real GDP. A change in the price level of the economy results in an expansion or a contraction of aggregate demand curve. But why is the aggregate demand curve this shape? Well there are three reasons:
The aggregate demand curve looks exactly the same as a normal demand curve but remember that it maps out two completely different variables. A normal demand curve maps out price against quantity. Aggregate demand maps out the price level and real output.
A change in any of the components of aggregate demand will result in a shift of the AD curve. These shifts will be discussed later.
The aggregate demand curve plots the price level against real output/ real GDP. A change in the price level of the economy results in an expansion or a contraction of aggregate demand curve. But why is the aggregate demand curve this shape? Well there are three reasons:
- Falling real incomes – price rises mean that individuals real income falls resulting in them being able to buy less of the goods and services which they want.
- The balance of trade – if the price level within a country continued to rise, then foreign goods and services would appear cheaper in comparison to ours, meaning that consumers would switch from domestic goods to foreign ones. Also, as the relative price of our goods and services has increased, it would mean we are less competitive globally resulting in other countries choosing to make their goods and services domestically or buy from another country. As we move along our aggregate demand curve both domestic demand and foreign demand for domestic good increases.
The aggregate demand curve looks exactly the same as a normal demand curve but remember that it maps out two completely different variables. A normal demand curve maps out price against quantity. Aggregate demand maps out the price level and real output.
A change in any of the components of aggregate demand will result in a shift of the AD curve. These shifts will be discussed later.