3.1 AGGREGATE SUPPLY
|
|
|
This video is relevant for this section despite it saying that it is for AQA.
The aggregate supply curve is defined as the volume of goods and services produced over a given time period (usually a year). Aggregate supply measures the ability of an economy to produce goods and services that meet demand. Consumer goods, capital goods, public goods, merit goods and goods for overseas markets (exports) are included in AS. In an economy we have a short run and a long run aggregate supply curve.
|
Short Run Aggregate Supply
The short run aggregate supply curve shows how total planned output changes in response to a change in the price level, whilst keeping the prices and productivity of factors of productions the same. The short-run AS curve is upwards sloping due to the law of supply, which suggests that firms will plan to produce more output if the price level increases, and would produce less output if the price level decreases. Therefore a change in the price level results in a movement along the short-run AS curve.A change in the conditions of supply will cause the short-run AS curve to shift. A favorable shock to supply will cause an outwards shift of the short-run AS curve, and an adverse shock would cause an inwards shift. Examples can be:
There are two different schools of thought when looking at the aggregate supply curve. The classical view is represented above with a straight line. The other school of thought is the Keynesian aggregate supply curve, which is non-linear (as can be seen in the diagram further down).
The short run aggregate supply curve shows how total planned output changes in response to a change in the price level, whilst keeping the prices and productivity of factors of productions the same. The short-run AS curve is upwards sloping due to the law of supply, which suggests that firms will plan to produce more output if the price level increases, and would produce less output if the price level decreases. Therefore a change in the price level results in a movement along the short-run AS curve.A change in the conditions of supply will cause the short-run AS curve to shift. A favorable shock to supply will cause an outwards shift of the short-run AS curve, and an adverse shock would cause an inwards shift. Examples can be:
- Changes in employment costs (wages and employment taxes).
- Changes in other factor costs such as raw materials. Commodity prices around the world are constantly changing and this affects the SRAS curve. Oil is a key commodity for firms as it is in joint demand and there are very few substitutes.
- Government policy. If a government wishes to push through certain environmental laws or taxes that make the cost of production more expensive, then the SRAS will shift inwards. This also applies to corporation taxes. An increase in corporation tax reduces the incentive of firms to produces goods resulting in the SRAS shifting inwards and vice versa for a decrease in corporation tax.
There are two different schools of thought when looking at the aggregate supply curve. The classical view is represented above with a straight line. The other school of thought is the Keynesian aggregate supply curve, which is non-linear (as can be seen in the diagram further down).
Long Run Aggregate Supply
The long run aggregate supply curve is determined by all factors of production, such as the size of the work force, size of the capital stock and labour productivity levels. The LRAS is potential output of the economy. It is the maximum output that can be produced and is vertical. A change in a factor that affects potential output will cause a shift in the LRAS. For example:
The long run aggregate supply curve is determined by all factors of production, such as the size of the work force, size of the capital stock and labour productivity levels. The LRAS is potential output of the economy. It is the maximum output that can be produced and is vertical. A change in a factor that affects potential output will cause a shift in the LRAS. For example:
- An increase in investment levels (either investing in human or nonhuman capital) will shift the LRAS outwards, as investment will increase the productive potential of the economy.
- Technological advancement will increase the level of labour productivity, causing the LRAS to shift outwards.
- A major national disaster would result in the LRAS shifting inwards as the economy would not be able to produce as much as it used to because machinery and infrastructure would have been damaged from the natural disaster.
There are two views of the long run aggregate supply curve. The first one is the classic view. They believe that the LRAS is always perfectly inelastic. They believe that markets may not be in equilibrium in the short run but in the long run they will all clear, with the maximum output being produced. The price level in the long run is fully flexible, and will be where ever the AD curve crosses the LRAS curve.
The second view is the Keynesian view. He suggested that the economy could be in an equilibrium in the long run where output was below its potential, resulting in unemployment of factors of production being high. The Keynesian LRAS is below.
The second view is the Keynesian view. He suggested that the economy could be in an equilibrium in the long run where output was below its potential, resulting in unemployment of factors of production being high. The Keynesian LRAS is below.
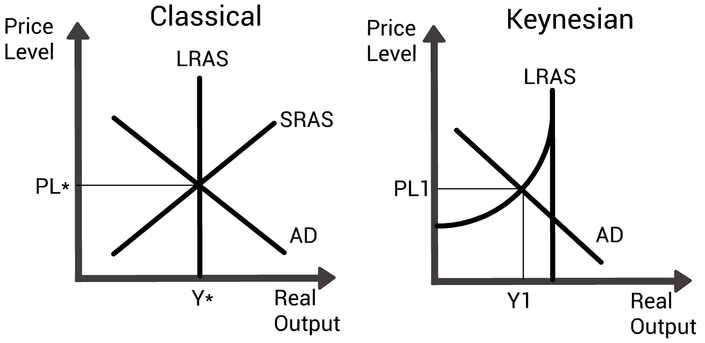
A comparison between the Classical and Keynesian AS curves.
In the Keynesian diagram below you can see that there is a variety of different output levels where the economy can be in equilibrium. At Y1 or Y2 the economy is not making full use of all of its resources. With this being the case, there is a case for government intervention. If the economy had a level of aggregate demand of AD1, the economy would be producing a level of real output of Y1. This is considerable lower than what the economy could produce if all of it's resources were working at their full potential. Therefore, the economy will have a negative output gap . The negative output gap could be closed by governments intervening in the economy to increase the level of aggregate demand and push the economy towards its long run potential. For example, the government could increase their expenditure and this would cause AD to shift to the right (AD1 to AD2), which leads to a new equilibrium with more real output (Y2 rather than Y1) and a higher price level (PL2 rather than PL1).
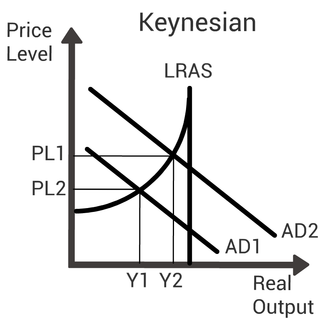 A Keynesian diagram showing a negative output gap (when we have AD1) and what the effect of an increases in government spending would have on the economy.
Keynesian economists believe that the government has a role when the economy is in this situation. Due to the multiplier effect, the government may only have to increase their expenditure by less than is needed, as spending will create jobs for people and this increases disposable incomes of workers, which increases consumption (AD to the right) and this continues.
When an economy gets close to its long run productive potential, an increase in demand results in an increase in the price level. An increase in aggregate demand on the vertical part of the LRAS curve will have no effect on output and only change the price level in the economy.
When an economy gets close to its long run productive potential, an increase in demand results in an increase in the price level. An increase in aggregate demand on the vertical part of the LRAS curve will have no effect on output and only change the price level in the economy.