Paper 2 H - SAMPLE SET 1 Q4
4) The nervous system allows humans to respond to their surroundings.
Figure 4 shows two nerve pathways.
Figure 4 shows two nerve pathways.
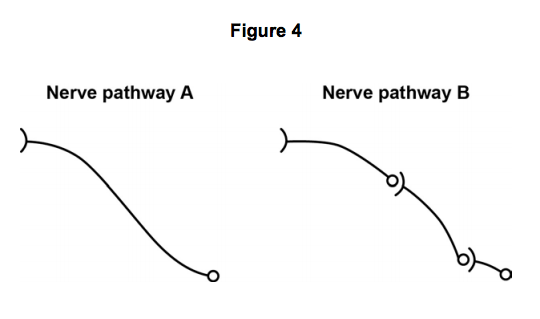
Nerve pathway A is 92 cm long.
A nerve impulse travels along pathway A at 76.2 m/s.
Calculate how long it takes for the nerve impulse to travel the length of the pathway.
Use the equation: [3 marks]
A nerve impulse travels along pathway A at 76.2 m/s.
Calculate how long it takes for the nerve impulse to travel the length of the pathway.
Use the equation: [3 marks]
distance = speed × time
Time = __________ s
4.2) Nerve pathways A and B are the same length.
The nerve impulse takes longer to travel along pathway A than along pathway B.
Use Figure 4 to explain why. [3 marks]
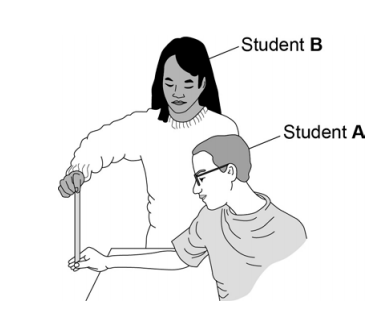
Two students compare their reactions using a ruler.
This is the method used.
The nerve impulse takes longer to travel along pathway A than along pathway B.
Use Figure 4 to explain why. [3 marks]
Two students compare their reactions using a ruler.
This is the method used.
- Student A sits with his elbow on a table top.
- Student B holds the ruler so the bottom of the ruler is level with the top of student A’s thumb.
- Student B drops the ruler.
- Student A catches the ruler.
- Record the drop distance.
- Repeat steps 1 to 5 four more times.
- Repeat the whole experiment with student A dropping the ruler and student B catching it.
Both students are right-handed.
Student A uses his right hand to catch the ruler.
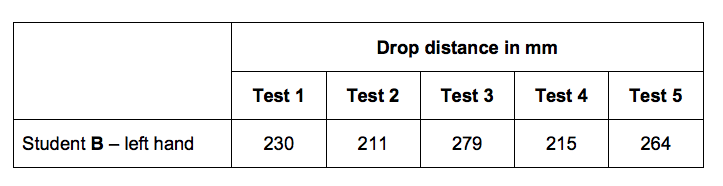
Student B uses her left hand to catch the ruler.
Table 2 shows the students’ results.
Student A uses his right hand to catch the ruler.
Student B uses her left hand to catch the ruler.
Table 2 shows the students’ results.
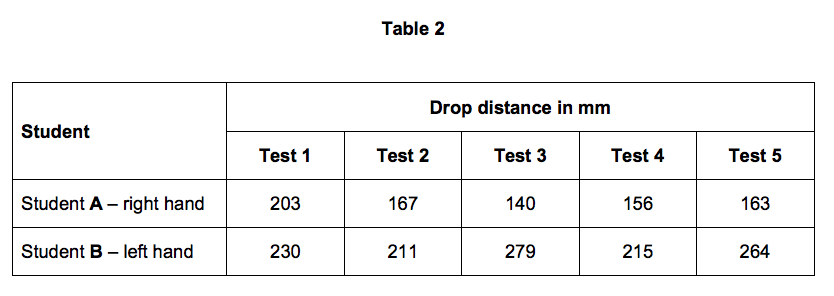
4.3) What is the range of student A’s results? [1 mark]
4.4) The students are testing the hypothesis:
The drop distance of the ruler is smaller when a right-handed person uses their right hand to catch the ruler.
The students’ results in Table 2 are not a good test of the hypothesis.
Suggest what the students should have done to test the hypothesis. [3 marks]
4.5) Student A’s mean reaction time was 0.19 s.
Mean reaction time can be calculated using the equation:
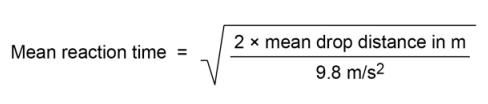
Calculate the mean reaction time for Student B.
Give your answer to two significant figures.
Student B’s results are repeated here to help you answer the question.
Give your answer to two significant figures.
Student B’s results are repeated here to help you answer the question.
Mean reaction time = ____________ s
(Total for Question 4 = 14 marks)