Back to AQA Representing Data (F) Home
Representing Data: Quiz 7
Representing Data: Quiz 7
Click here for a printable PDF of the pie charts and table in this quiz.
1) The pie chart below shows the number of people that play different instruments in an orchestra.
1) The pie chart below shows the number of people that play different instruments in an orchestra.
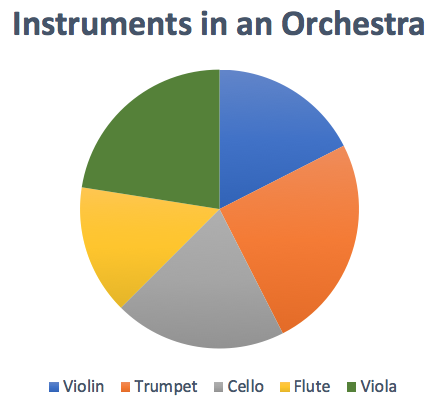
7 people play the violin.
a) Find the number of degrees that represents 1 person.
b) Find the total number of people in the orchestra.
c) Find the number of people who play the trumpet.
d) What fraction of the orchestra is made up by people who play the trumpet?
2) The pie chart below shows the number of gold, silver and bronze medals that a country won at the Olympics.
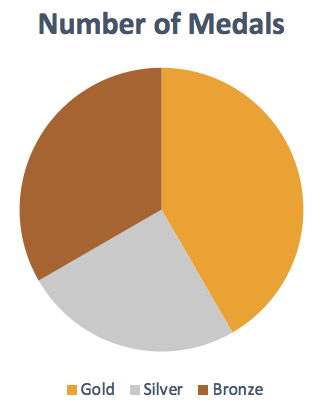
The country won 10 gold medals.
a) Find the number of degrees that represents 1 medal.
b) Find the number of bronze medals that the country won.
c) How many medals did the country win in total?
d) What fraction of the total medals were bronze?
3) The table below shows how I spend my earnings in a given month.
a) Find the number of degrees that represents 1 medal.
b) Find the number of bronze medals that the country won.
c) How many medals did the country win in total?
d) What fraction of the total medals were bronze?
3) The table below shows how I spend my earnings in a given month.
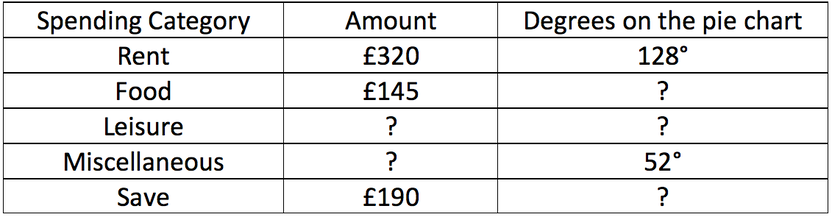
a) Fill in the table.
b) Draw the pie chart.
c) How much money do I earn a month?
d) What fraction of my earnings do I save?
b) Draw the pie chart.
c) How much money do I earn a month?
d) What fraction of my earnings do I save?