Back to AQA Probability (H) Home
5 R) Venn Diagrams – Part 1
5 R) Venn Diagrams – Part 1
Venn diagrams are a useful way of representing data. They are very useful when we are looking at probabilities or outcomes that are concerned with “and” or “or”. They are also very useful for conditional probability, which we will be looking at in a later part (part 4).
Venn diagrams have circles and if you are inside a circle, it tells us that the individual is included in that set. If you are outside the circle, it means that the individual does not appear in that set. The most obvious example of this is a single circled Venn diagram. You will rarely see a single Venn diagram, but a single Venn diagram is a good way to introduce Venn diagrams.
Venn diagrams have circles and if you are inside a circle, it tells us that the individual is included in that set. If you are outside the circle, it means that the individual does not appear in that set. The most obvious example of this is a single circled Venn diagram. You will rarely see a single Venn diagram, but a single Venn diagram is a good way to introduce Venn diagrams.
Example 1
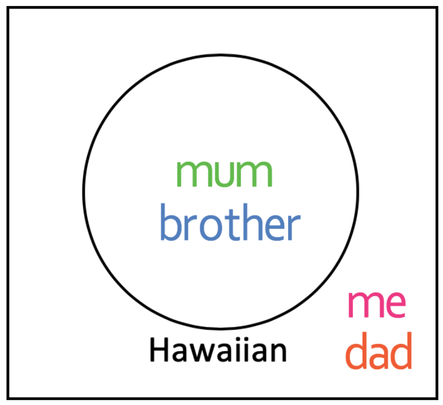
I am going to be looking at a Venn diagram of liking Hawaiian pizza.
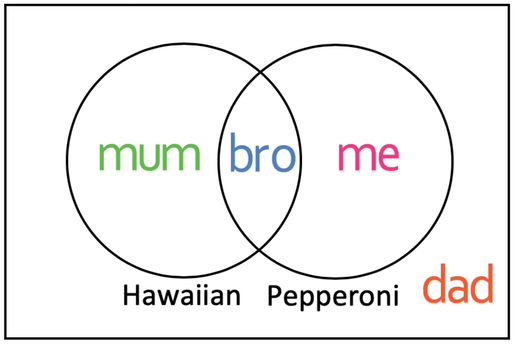
If you like Hawaiian pizza, you will be inside the circle and if you do not like Hawaiian pizza, you will be outside the circle. My farther and I do not like Hawaiian pizza, which means that we will appear outside of the circle. My mother and brother do like Hawaiian pizza, which means that they will appear inside the circle. The Venn diagram is shown below.
I am going to be looking at a Venn diagram of liking Hawaiian pizza.
If you like Hawaiian pizza, you will be inside the circle and if you do not like Hawaiian pizza, you will be outside the circle. My farther and I do not like Hawaiian pizza, which means that we will appear outside of the circle. My mother and brother do like Hawaiian pizza, which means that they will appear inside the circle. The Venn diagram is shown below.
Example 2
The above example was a little bit pointless and didn’t really warrant using a Venn diagram, but I am now going to make the example a little bit more complicated by including a circle that represents the liking of pepperoni pizza. The diagram below shows how we will set up the Venn diagram.
The above example was a little bit pointless and didn’t really warrant using a Venn diagram, but I am now going to make the example a little bit more complicated by including a circle that represents the liking of pepperoni pizza. The diagram below shows how we will set up the Venn diagram.
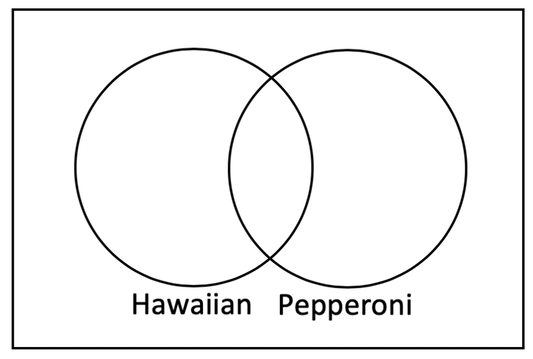
There are two circles above; the circle on the left is showing the liking of Hawaiian pizza and the circle on the right is showing that you like pepperoni pizza. If you appear inside the circle on the left it means that the individual likes Hawaiian Pizza, and if you appear outside the left circle, it means that you do not like Hawaiian pizza. If you appear inside the circle on the right, it means that you like pepperoni pizza and if you appear outside the right circle, it means that you do not like pepperoni pizza.
There are 4 different parts to the Venn diagram and these are labelled A, B, C and D.
There are 4 different parts to the Venn diagram and these are labelled A, B, C and D.
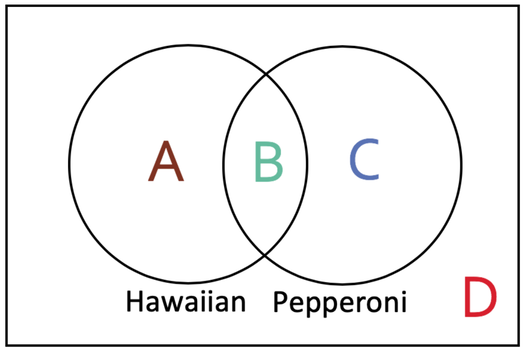
The first part that we are going to look at is the part that is in the middle of the diagram and it is the part that is in both parts of the circle. This is part B on the diagram. This part represents the individuals that like both Hawaiian and pepperoni pizza. This is because you are inside both the “likes Hawaiian” circle and the “likes pepperoni” circle.
The next part of the diagram that we are going to look at is on the left. This is part A on the Venn diagram. If you appear in this section, it means that you like Hawaiian pizza and do not like pepperoni pizza. This is because you are in the “like Hawaiian” circle meaning that you like Hawaiian, and you are outside the “like pepperoni” circle meaning that you do not like peperoni.
We have a similar part to this on the right side of the diagram. This is part C on the Venn diagram. If you appear is this part of the diagram it means that you like pepperoni pizza and do not like Hawaiian. This is because you appear in the “like pepperoni” circle meaning that you like peperoni and you appear outside of the “like Hawaiian” circle meaning that you do not like Hawaiian.
The final section on the diagram is outside both of the circles. This is part D on the Venn diagram. An individual that is in this category does not like either of the pizzas and this is because they are outside of both of the circles.
I am now going to place my family members into their appropriate categories in the Venn diagram. My family members and I have the following preferences towards Hawaiian and pepperoni pizzas:
I like pepperoni but not Hawaiian, which means that I will appear in the circle on the right, but not the circle on the left. This means that I am in part B.
My farther does not like pizza, which means that he will appear outside both of the circles. This is part D on the diagram.
My mother likes only Hawaiian, and this means that she will appear in the circle on the left, but not the circle on the right. This means that she is in part C on the diagram
Finally, my brother likes both of the pizzas and this means that he will appear in the middle section of the diagram where the two circles cross one another. This means that he will be in part B on the diagram.
The final Venn diagram will look like what is given below.
The next part of the diagram that we are going to look at is on the left. This is part A on the Venn diagram. If you appear in this section, it means that you like Hawaiian pizza and do not like pepperoni pizza. This is because you are in the “like Hawaiian” circle meaning that you like Hawaiian, and you are outside the “like pepperoni” circle meaning that you do not like peperoni.
We have a similar part to this on the right side of the diagram. This is part C on the Venn diagram. If you appear is this part of the diagram it means that you like pepperoni pizza and do not like Hawaiian. This is because you appear in the “like pepperoni” circle meaning that you like peperoni and you appear outside of the “like Hawaiian” circle meaning that you do not like Hawaiian.
The final section on the diagram is outside both of the circles. This is part D on the Venn diagram. An individual that is in this category does not like either of the pizzas and this is because they are outside of both of the circles.
I am now going to place my family members into their appropriate categories in the Venn diagram. My family members and I have the following preferences towards Hawaiian and pepperoni pizzas:
- I like pepperoni and do not like Hawaiian
- My dad does not like either of the pizzas
- My mother likes Hawaiian and does not like pepperoni
- My brother likes both of the pizzas
I like pepperoni but not Hawaiian, which means that I will appear in the circle on the right, but not the circle on the left. This means that I am in part B.
My farther does not like pizza, which means that he will appear outside both of the circles. This is part D on the diagram.
My mother likes only Hawaiian, and this means that she will appear in the circle on the left, but not the circle on the right. This means that she is in part C on the diagram
Finally, my brother likes both of the pizzas and this means that he will appear in the middle section of the diagram where the two circles cross one another. This means that he will be in part B on the diagram.
The final Venn diagram will look like what is given below.
Example 2
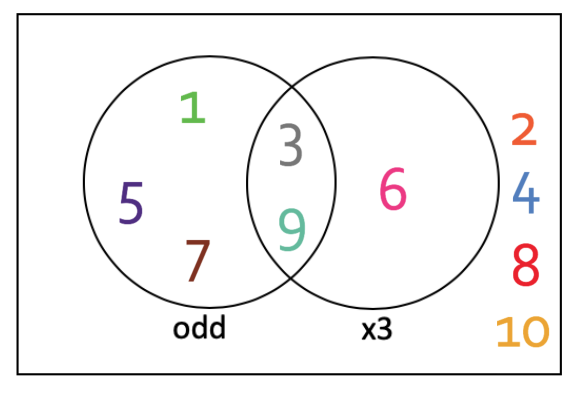
Place the numbers 1 to 10 in the correct place on the Venn diagram below.
Place the numbers 1 to 10 in the correct place on the Venn diagram below.
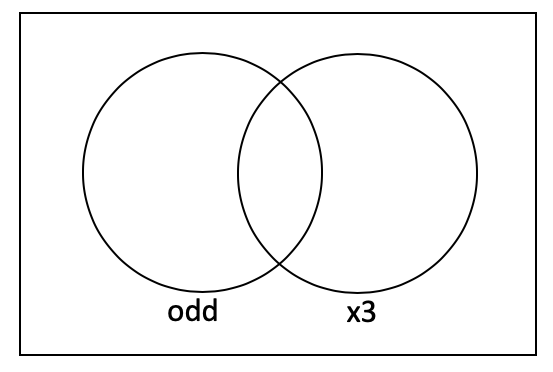
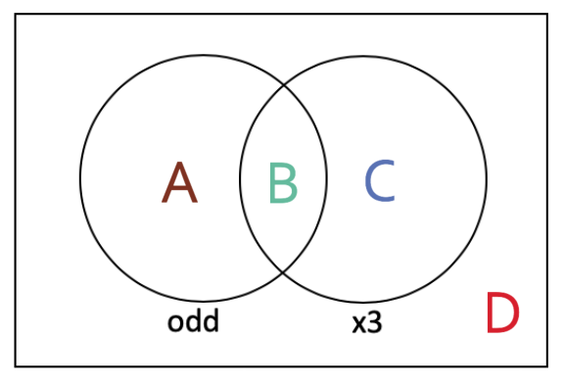
There are two different circles on the above diagram and four different sections. Before we start placing the numbers in the correct position on the Venn diagram, I am going to go label the four different sections and go through what each of them mean. The labelled sections are shown on the diagram below:
Here are what the different sections mean:
We are now ready to place the numbers from 1 to 10 in the correct place on the Venn diagram. It is best to work through the numbers methodically starting from 1 and ending with 10. This is so that you do not miss out any numbers. The outcome for this Venn diagram is shown below.
- A – these are odd numbers that are not a multiple of 3
- B – these are numbers that are both odd and a multiple of 3
- C – these are numbers that are a multiple of 3 and not odd
- D – these are numbers that are not odd and not a multiple of 3
We are now ready to place the numbers from 1 to 10 in the correct place on the Venn diagram. It is best to work through the numbers methodically starting from 1 and ending with 10. This is so that you do not miss out any numbers. The outcome for this Venn diagram is shown below.