Back to AQA Probability (H) Home
5 U) Venn Diagrams – Part 4: Conditional Probability
5 U) Venn Diagrams – Part 4: Conditional Probability
Conditional probability asks you to find the probability of something happening given that something else happens. Conditional probability questions tend to include works like “given”.
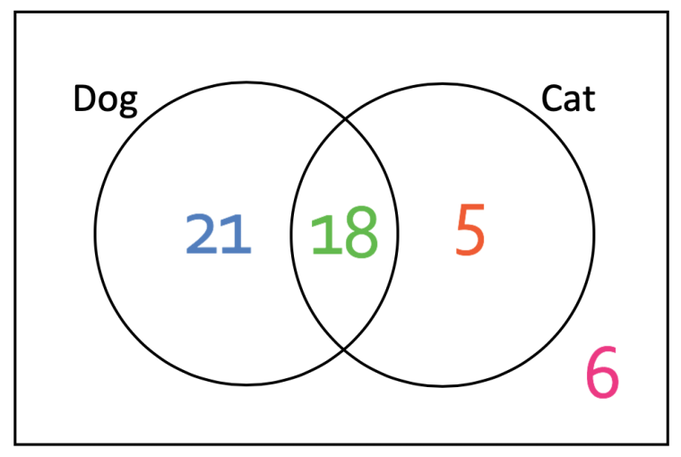
I am going to continue with the cats and dogs example and the Venn diagram is shown below:
I am going to continue with the cats and dogs example and the Venn diagram is shown below:
When you are working with conditional probability with Venn diagrams, you may find it easier to cover some parts of the Venn diagram so that only the given part of the Venn diagram is shown. This will make more sense after we have covered a few examples.
Question 1
Given that I like dogs, find the probability that I like cats.
I am going to start answering this question by covering up parts of the diagram so that only the given part of the Venn diagram is shown. Therefore, I am going to cover all of the diagram up except the part that shows individuals liking dogs – I will leave the likes dogs circle.
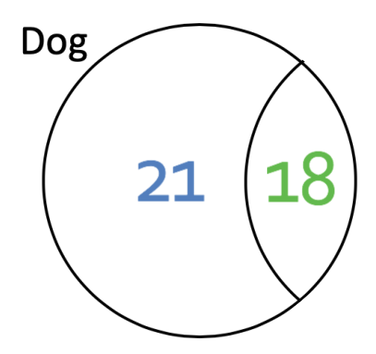
The next step is to find the number of individuals that like cats out of parts of the diagram that are left showing. There are 18 people on the diagram that like cats. There are 39 people that we are choosing from. This means that the probability is:

There are no common factors between the numerator and the denominator, which means that this fraction is already in its simplest form.
Questions 2
Given that an individual likes at least one animal, find the probability that they like both.
The first step is to cover up parts of the diagram so that only the given part of the diagram is shown. The given part in this question is that the individual must like at least one of the animals. There are 3 parts on the Venn diagram whereby individuals like at least one animal. These parts are:
The covered up Venn diagram looks like what is given below.
Given that an individual likes at least one animal, find the probability that they like both.
The first step is to cover up parts of the diagram so that only the given part of the diagram is shown. The given part in this question is that the individual must like at least one of the animals. There are 3 parts on the Venn diagram whereby individuals like at least one animal. These parts are:
- Likes dogs and not cats
- Likes dogs and cats
- Likes cats and not dogs
The covered up Venn diagram looks like what is given below.
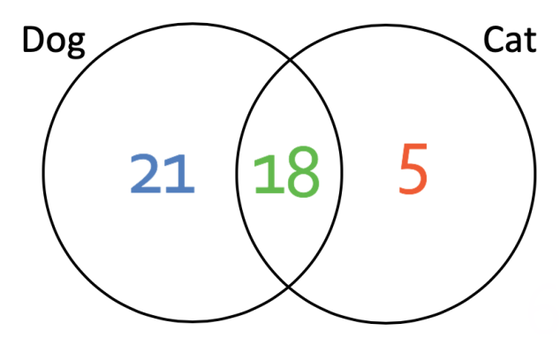
There are 44 individuals that like at least one of the animals (21 + 18 + 5).
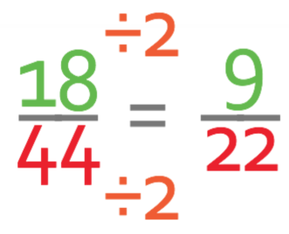
The next step is to find the number of individuals out of what is left showing on the Venn diagram that like both cats and dogs. Out of the part of the Venn diagram that is left, there are 18 individuals that like both cats and dogs. This means that the probability that they like both animals given that they like at least one is:
The next step is to find the number of individuals out of what is left showing on the Venn diagram that like both cats and dogs. Out of the part of the Venn diagram that is left, there are 18 individuals that like both cats and dogs. This means that the probability that they like both animals given that they like at least one is:

We can simplify this fraction by dividing both numerator and denominator by 2. Therefore, the answer is:
Question 3
Given that an individual does not like cats, what is the probability that they like dogs.
Like with the previous two examples, the first step is to cover up parts of the Venn diagram so that only the given parts are shown. The given part of this question is that the individual does not like cats. The parts of the diagram where individuals don’t like cats are all of the parts outside the “likes cats” circle. There are two different areas where individuals do not like cats and these are individuals who like dogs and do not like cats (the left) and individuals who do not like both dogs and cats (the outside).
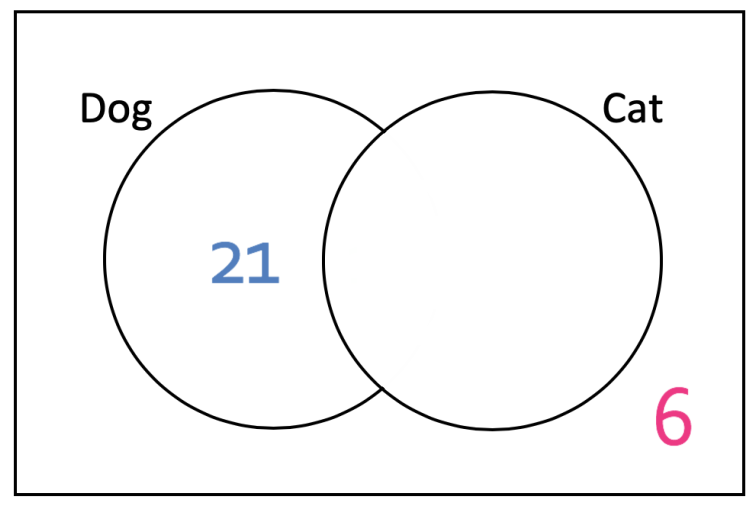
We now need to find the number of individuals out of who is left that like dogs. 21 individuals out of who is left like dogs. Therefore, the probability of choosing an individual that likes dogs given that they do not like cats is:

The numerator and the denominator both have a common factor of 3. Therefore, we can divide both the numerator and denominator by 3, which means that the fraction become:
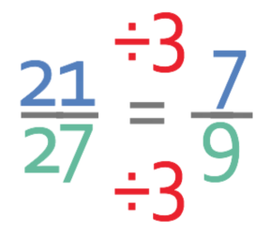
Therefore, the probability of choosing an individual that like dogs given that they do not like cats is 7/9.