Back to AQA Representing Data (H) Home
Representing Data: Quiz 10 - Answers
Representing Data: Quiz 10 - Answers
1)
a)
a)

b)
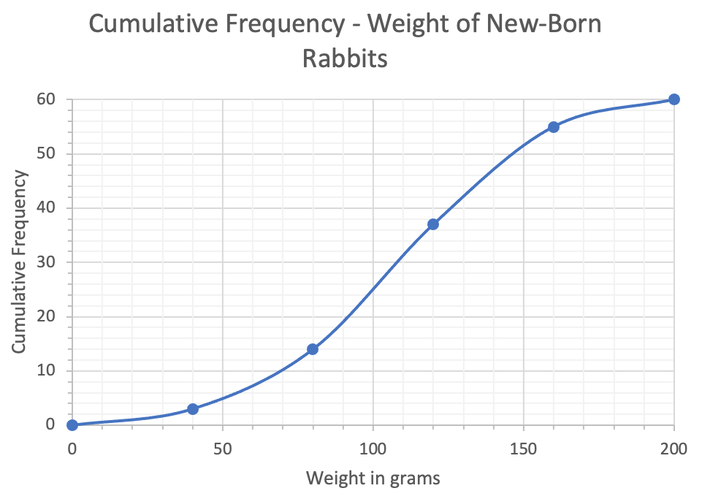
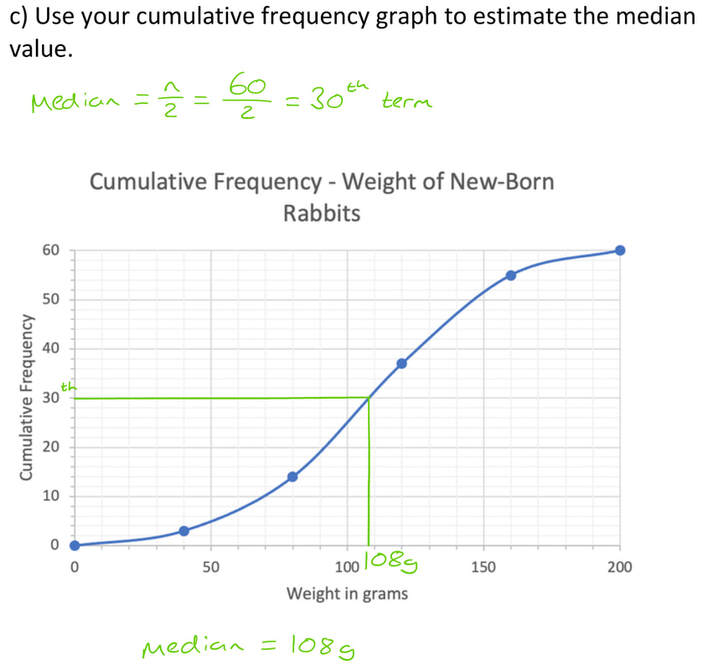
c) 105–110g
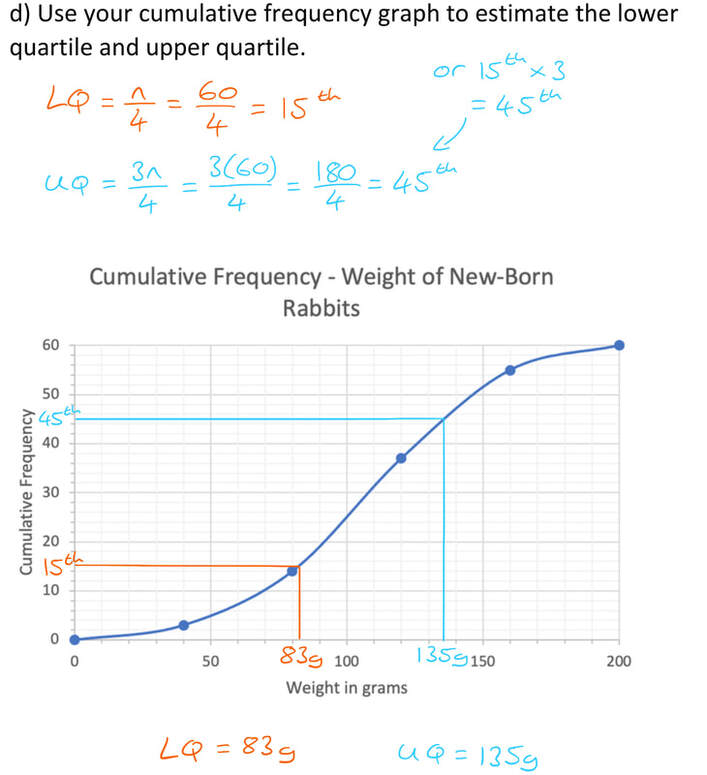
d) Lower Quartile = 81–86g
Upper Quartile = 133–138g
2)
a)
d) Lower Quartile = 81–86g
Upper Quartile = 133–138g
2)
a)
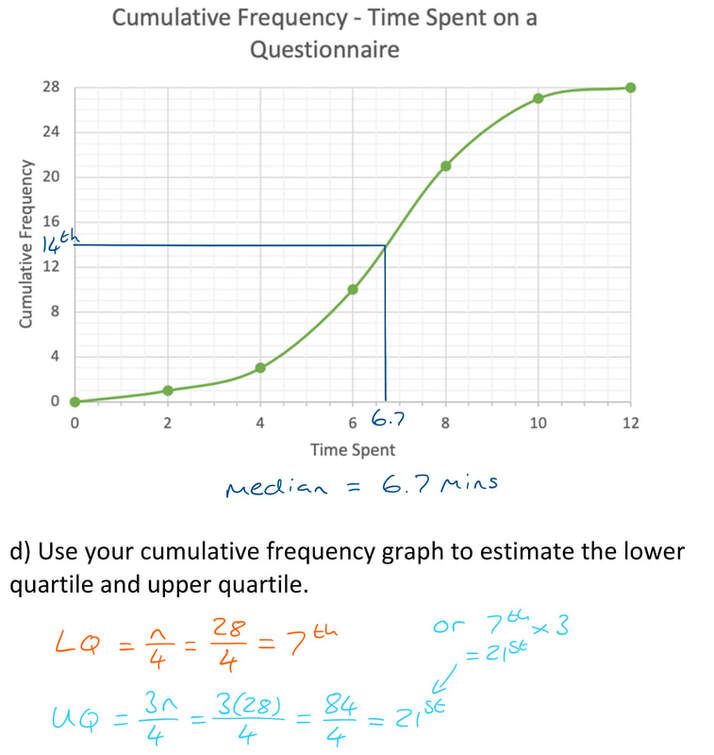
b)
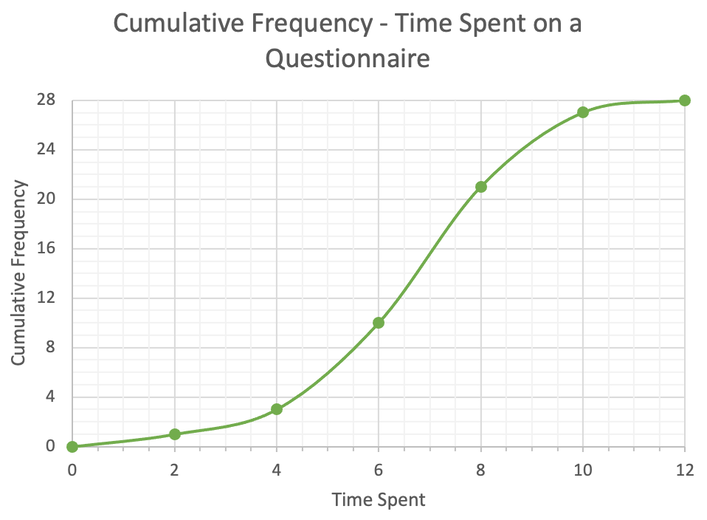
c) 6.5–7 mins
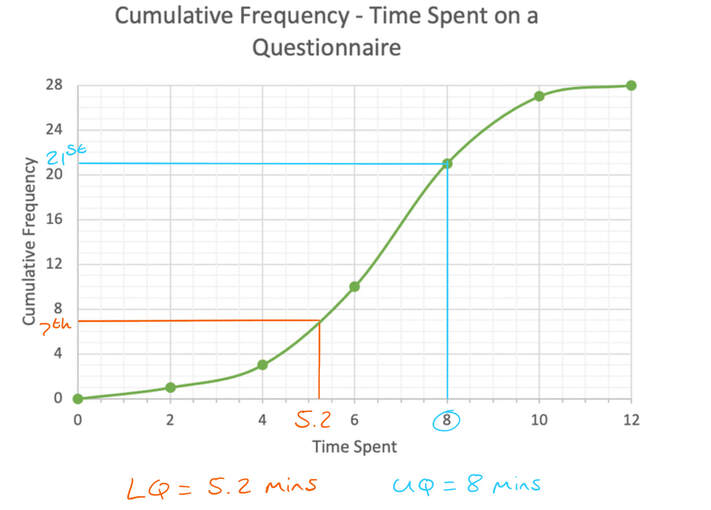
d) Lower Quartile = 5.0–5.6 mins
Upper quartile = 7.8-8.2mins
3)
a)
d) Lower Quartile = 5.0–5.6 mins
Upper quartile = 7.8-8.2mins
3)
a)
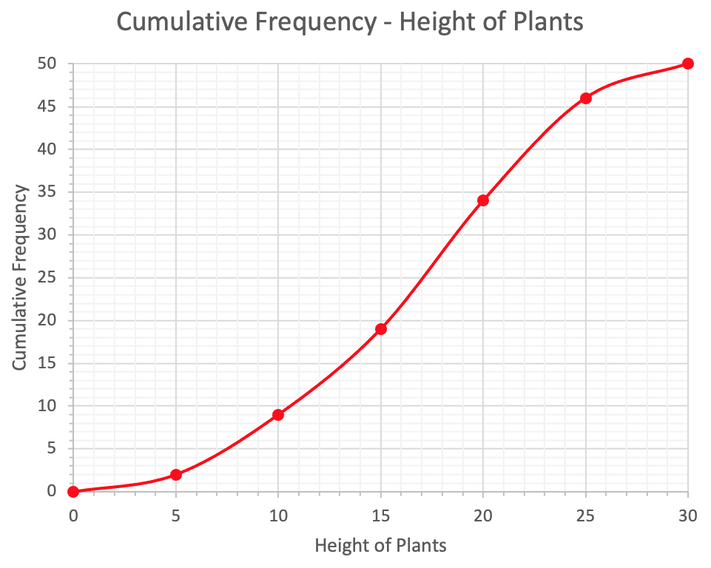
b) 6-10
c) 10-14
4)
a)
c) 10-14
4)
a)

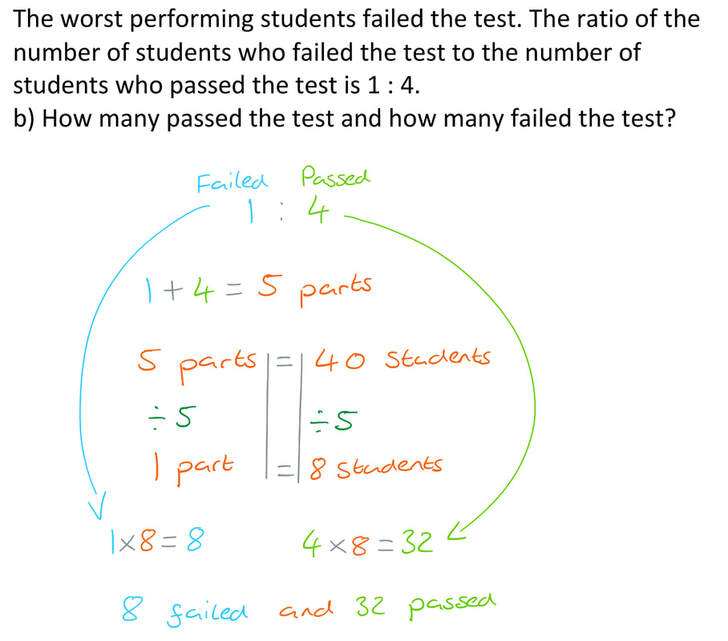
b) 8 failed and 32 passed
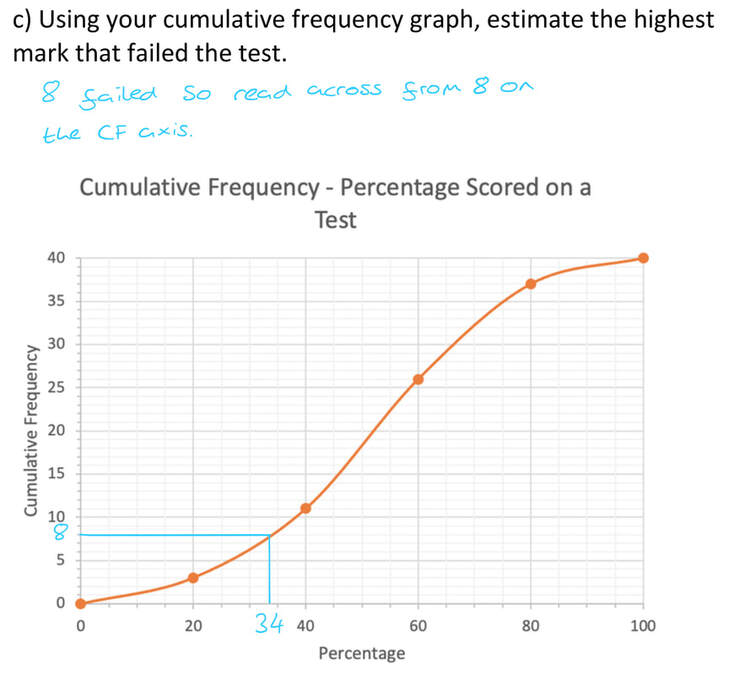
c) 31-37%
5)
a)
c) 31-37%
5)
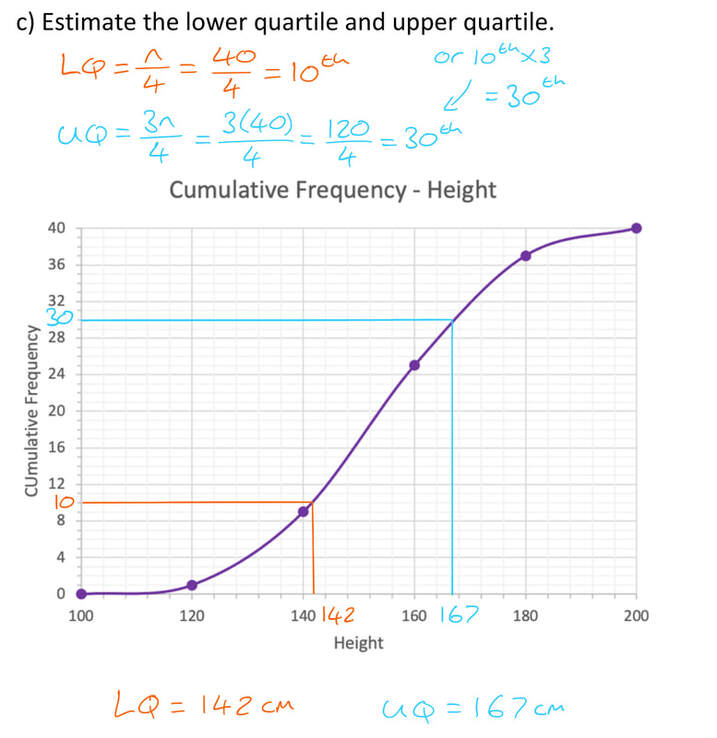
a)
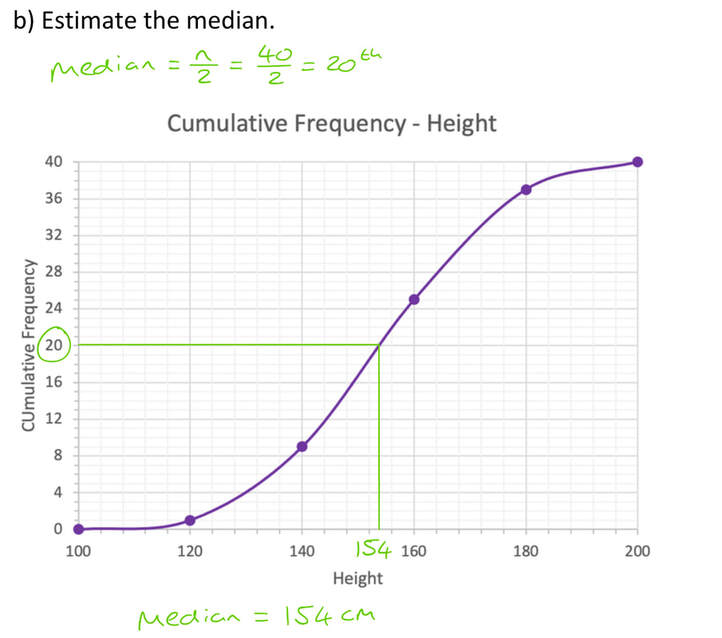
b) 151-157 cm
c) Lower Quartile = 140-144 cm
Upper quartile = 165-169 cm
c) Lower Quartile = 140-144 cm
Upper quartile = 165-169 cm
Working

Questions
Click here for a printable PDF of the tables and graphs in this quiz.
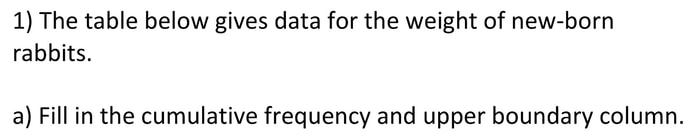
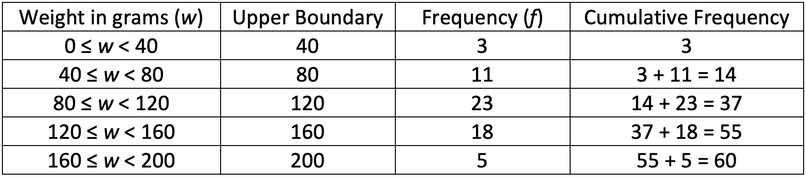
1) The table below gives data for the weight of new-born rabbits.
Click here for a printable PDF of the tables and graphs in this quiz.
1) The table below gives data for the weight of new-born rabbits.

a) Fill in the cumulative frequency and upper boundary column.
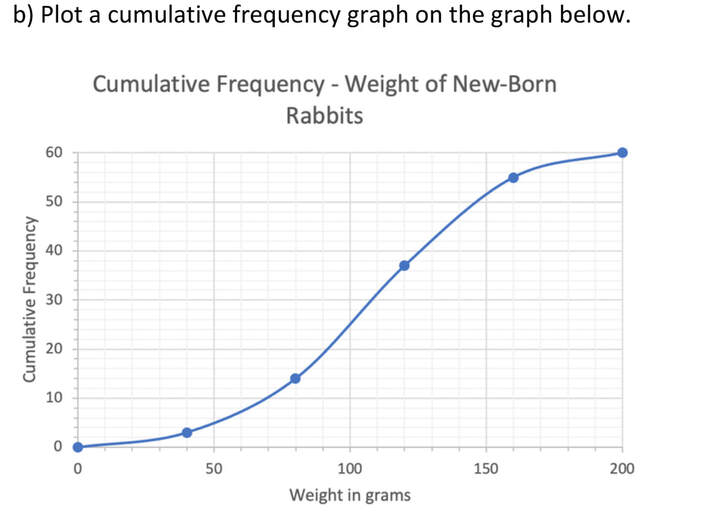
b) Plot a cumulative frequency graph on the graph below.
b) Plot a cumulative frequency graph on the graph below.
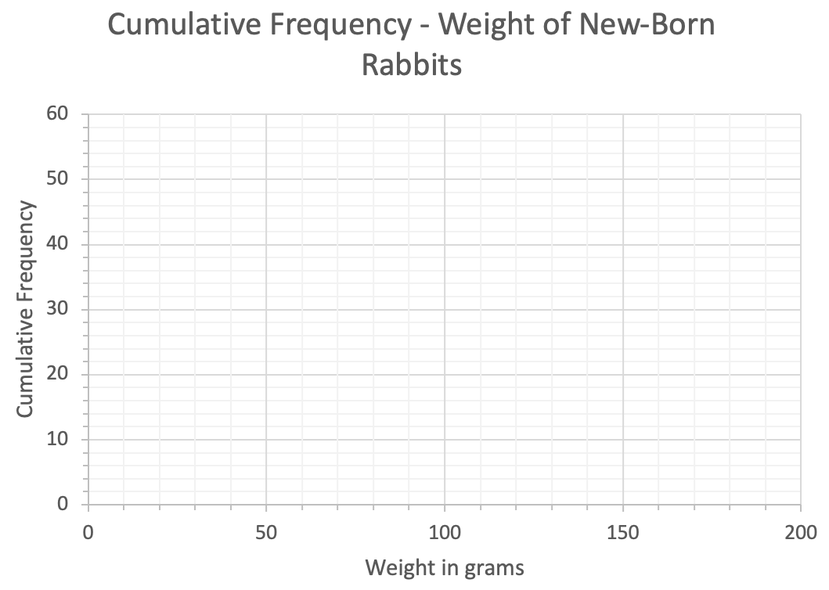
c) Use your cumulative frequency graph to estimate the median value.
d) Use your cumulative frequency graph to estimate the lower quartile and upper quartile.
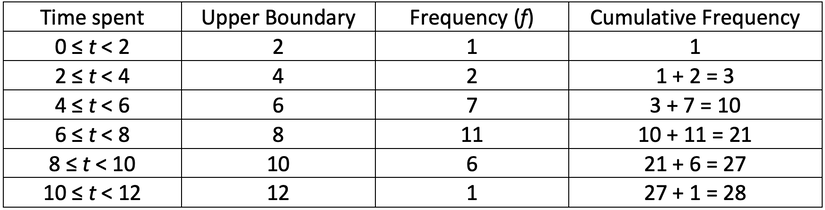
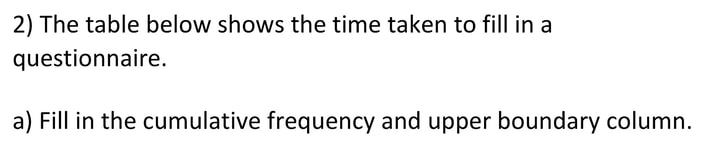
2) The table below shows the time taken to fill in a questionnaire.
d) Use your cumulative frequency graph to estimate the lower quartile and upper quartile.
2) The table below shows the time taken to fill in a questionnaire.
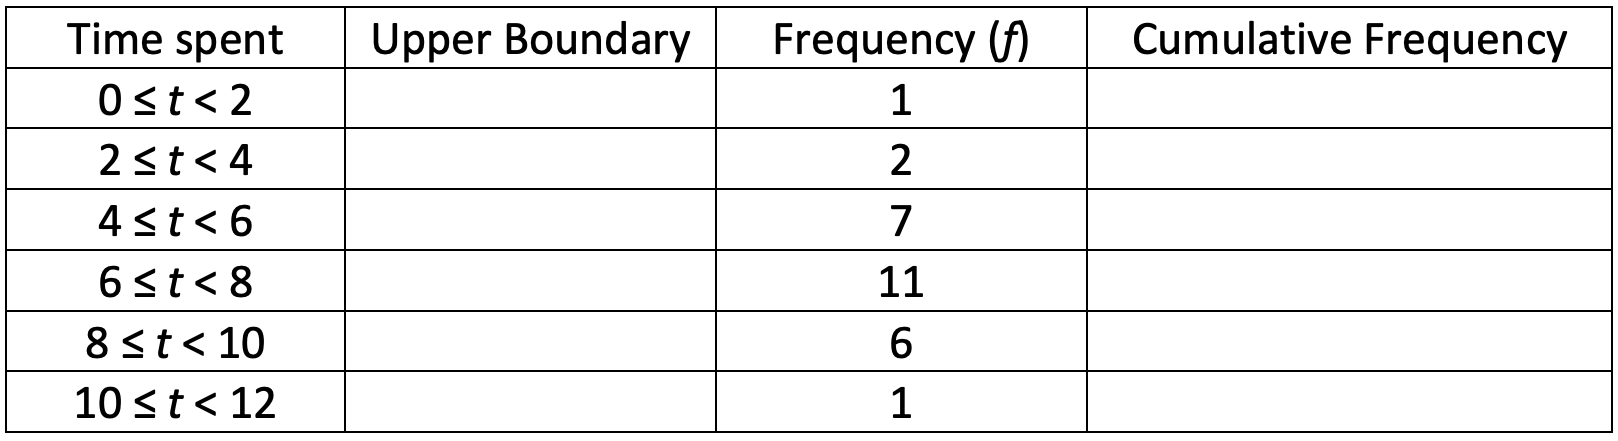
a) Fill in the cumulative frequency and upper boundary column.
b) Plot a cumulative frequency graph on the graph below.
b) Plot a cumulative frequency graph on the graph below.
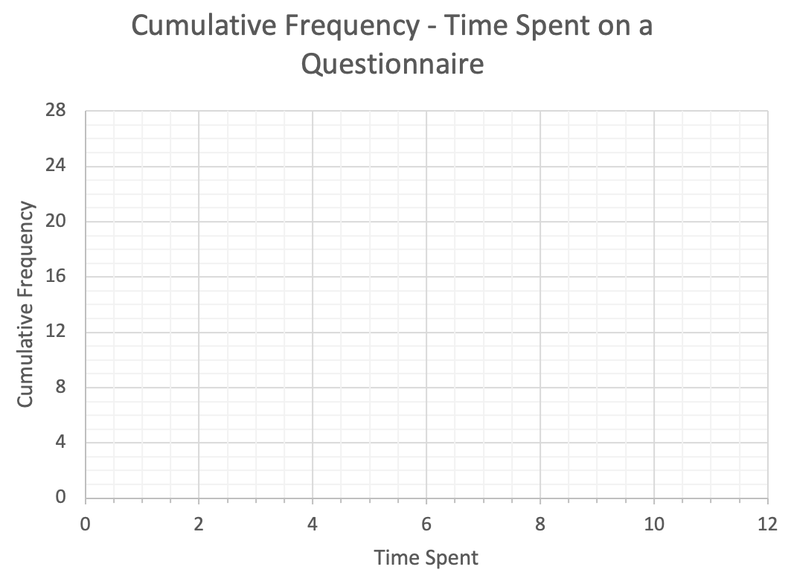
c) Use your cumulative frequency graph to estimate the median value.
d) Use your cumulative frequency graph to estimate the lower quartile and upper quartile.
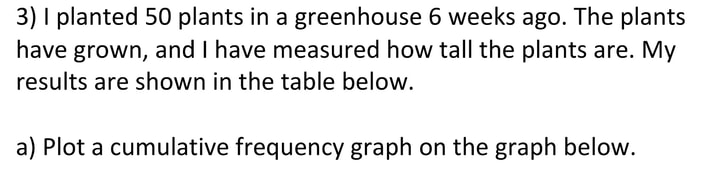
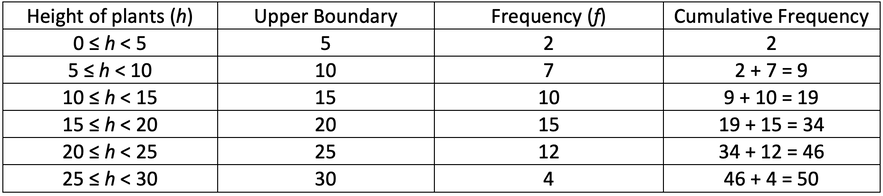
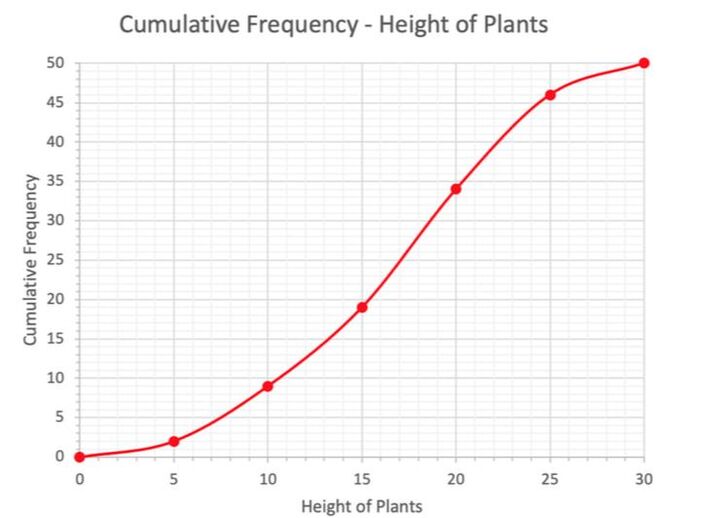
3) I planted 50 plants in a greenhouse 6 weeks ago. The plants have grown, and I have measured how tall the plants are. My results are shown in the table below.
d) Use your cumulative frequency graph to estimate the lower quartile and upper quartile.
3) I planted 50 plants in a greenhouse 6 weeks ago. The plants have grown, and I have measured how tall the plants are. My results are shown in the table below.
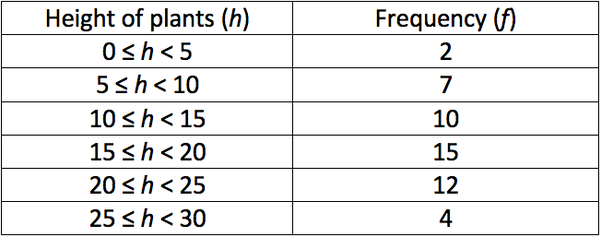
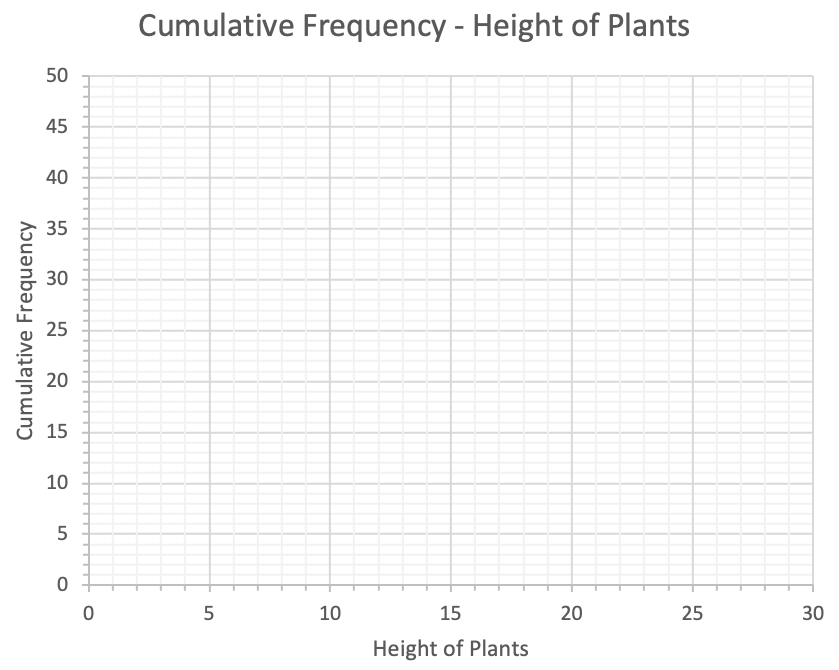
a) Plot a cumulative frequency graph on the graph below.
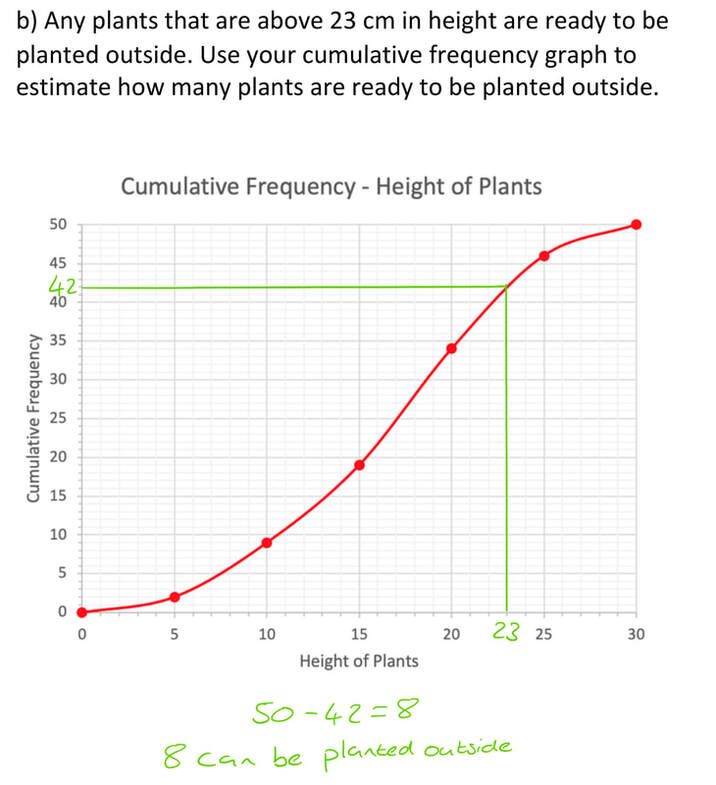
b) Any plants that are above 23 cm in height are ready to be planted outside. Use your cumulative frequency graph to estimate how many plants are ready to be planted outside.
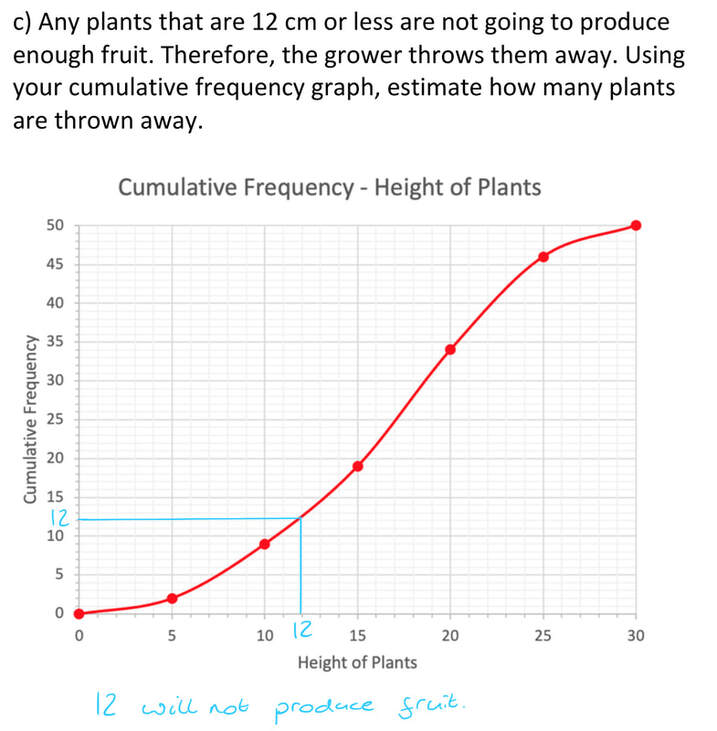
c) Any plants that are 12 cm or less are not going to produce enough fruit. Therefore, the grower throws them away. Using your cumulative frequency graph, estimate how many plants are thrown away.
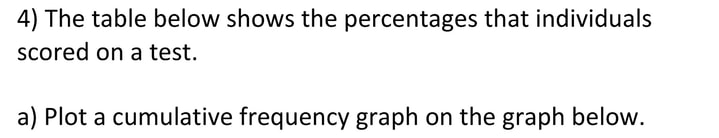
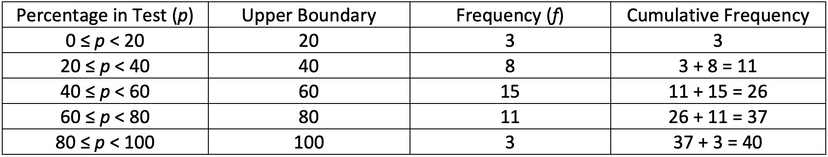
4) The table below shows the percentages that individuals scored on a test.
c) Any plants that are 12 cm or less are not going to produce enough fruit. Therefore, the grower throws them away. Using your cumulative frequency graph, estimate how many plants are thrown away.
4) The table below shows the percentages that individuals scored on a test.
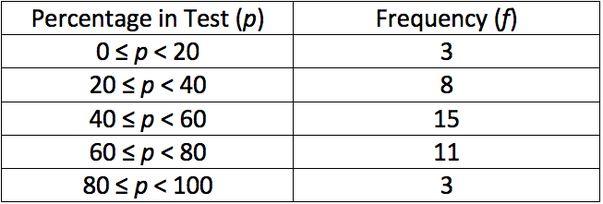
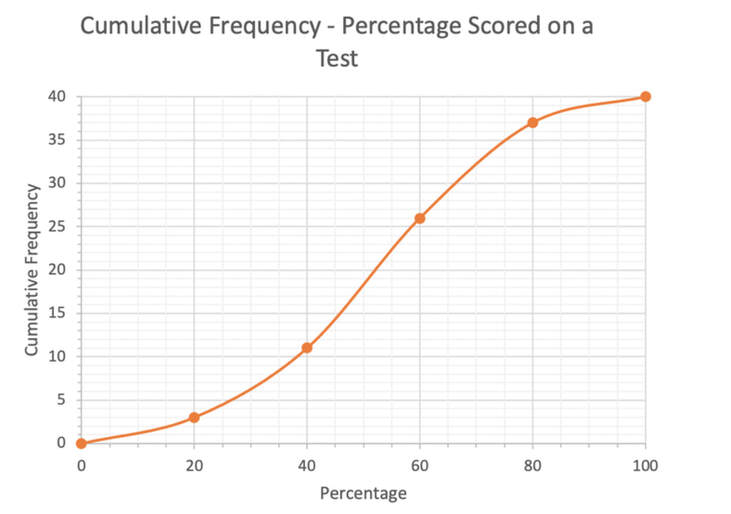
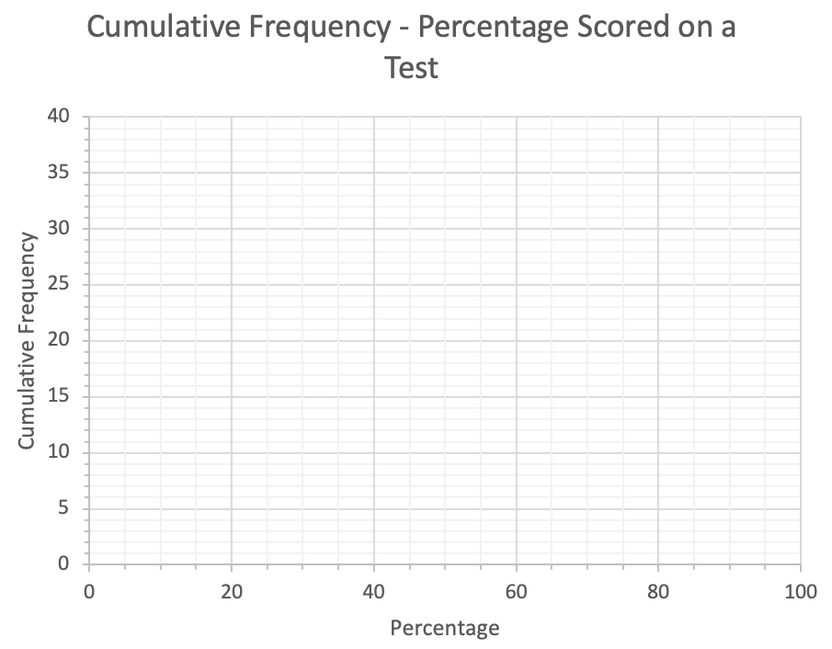
a) Plot a cumulative frequency graph on the graph below.
The worst performing students failed the test. The ratio of the number of students who failed the test to the number of students who passed the test is 1 : 4.
b) How many passed the test and how many failed the test?
c) Using your cumulative frequency graph, estimate the highest mark that failed the test.
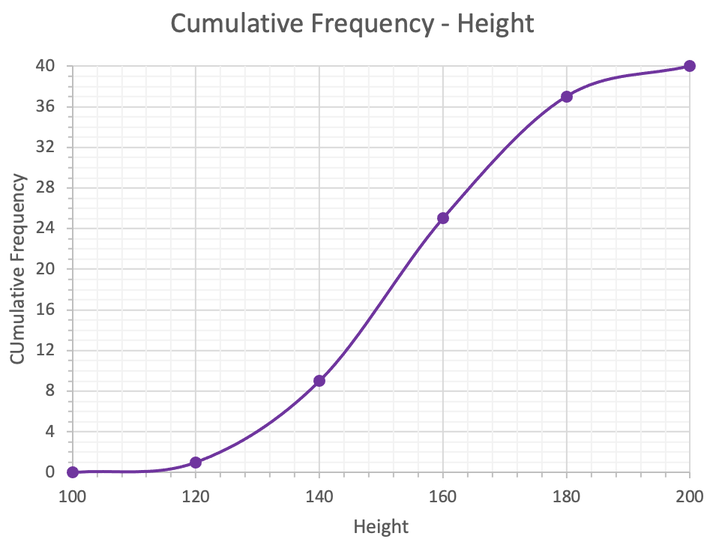
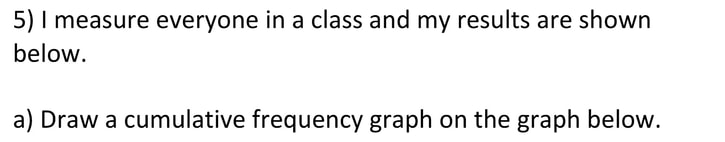
5) I measure everyone in a class and my results are shown below.
b) How many passed the test and how many failed the test?
c) Using your cumulative frequency graph, estimate the highest mark that failed the test.
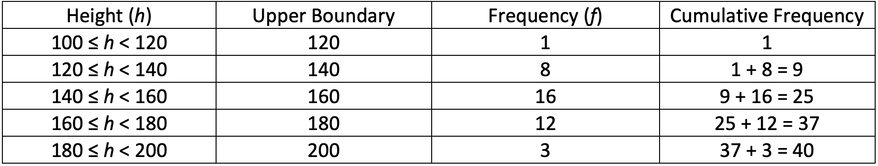
5) I measure everyone in a class and my results are shown below.
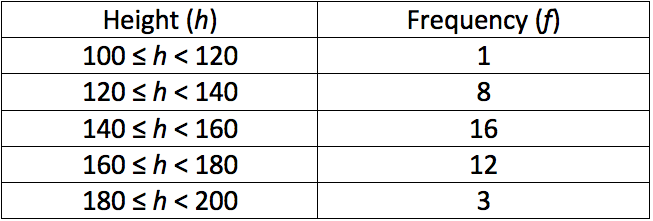
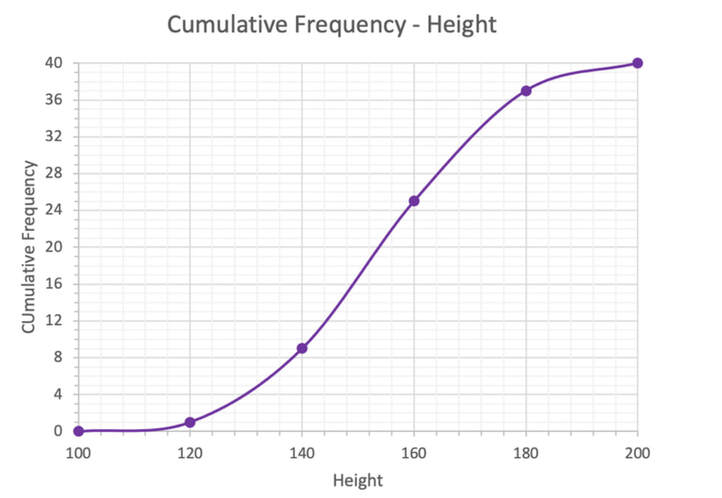
a) Draw a cumulative frequency graph on the graph below.
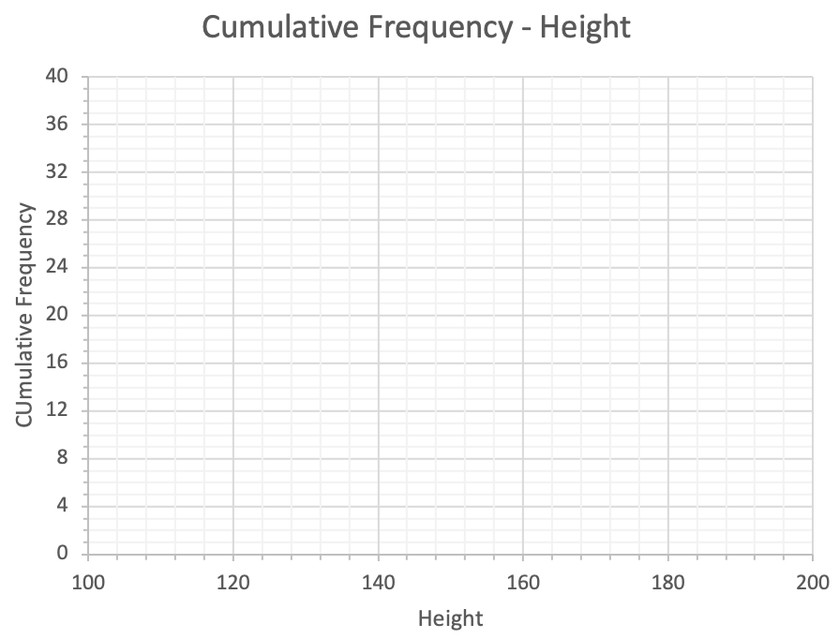
b) Estimate the median.
c) Estimate the lower quartile and upper quartile.
c) Estimate the lower quartile and upper quartile.