Back to AQA Representing Data (H) Home
Representing Data: Quiz 6 - Answers
Representing Data: Quiz 6 - Answers
1)
a) 10°
b)
a) 10°
b)
c)
d) Blue
2)
a) 3°
b)
2)
a) 3°
b)
c)
d) Football
3)
a) 0.05°
b)
3)
a) 0.05°
b)
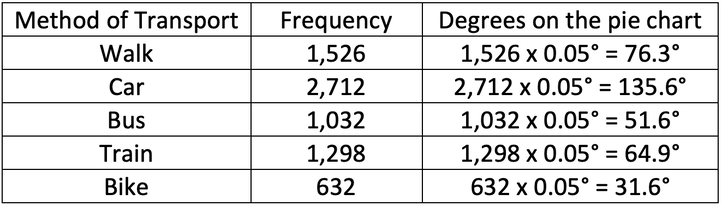
c)
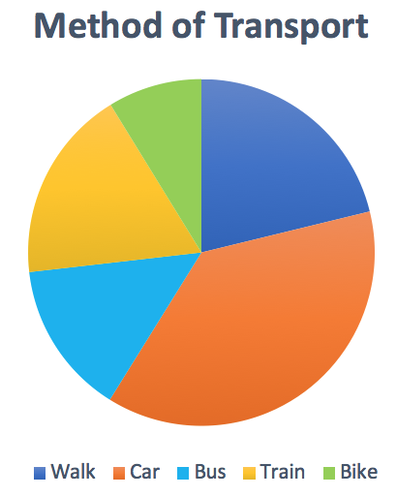
d) Car
There is no working for this quiz!
Questions
Click here for a printable PDF of the tables in this quiz and a few blank pie charts.
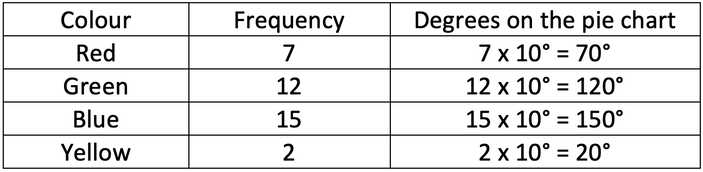
1) 36 students were asked what their favourite colour was out of red, green, blue and yellow. The table below shows the results.
Click here for a printable PDF of the tables in this quiz and a few blank pie charts.
1) 36 students were asked what their favourite colour was out of red, green, blue and yellow. The table below shows the results.
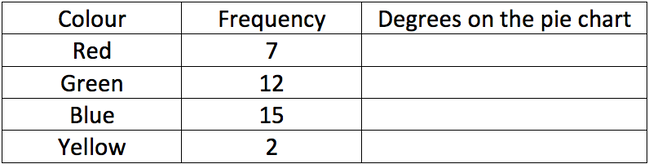
a) How many degrees does 1 person represent?
b) Fill in the table.
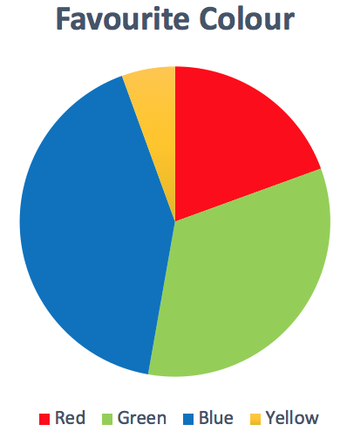
c) Draw the pie chart.
d) What is the mode?
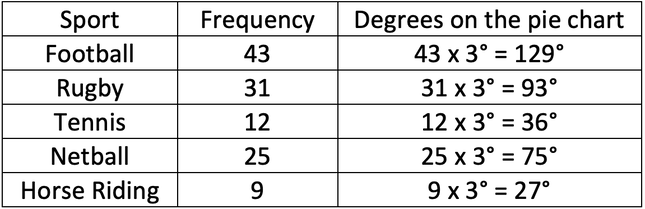
2) I asked 120 people what their favourite sport is out of football, rugby, tennis, netball and horse riding. My results are shown in the table below.
b) Fill in the table.
c) Draw the pie chart.
d) What is the mode?
2) I asked 120 people what their favourite sport is out of football, rugby, tennis, netball and horse riding. My results are shown in the table below.
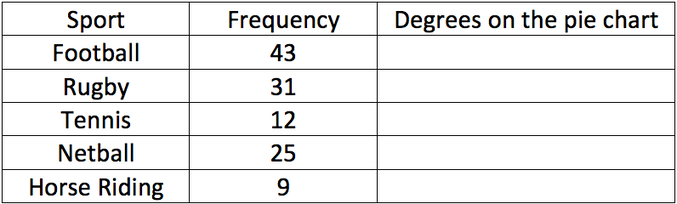
a) How many degrees does 1 person represent?
b) Fill in the table.
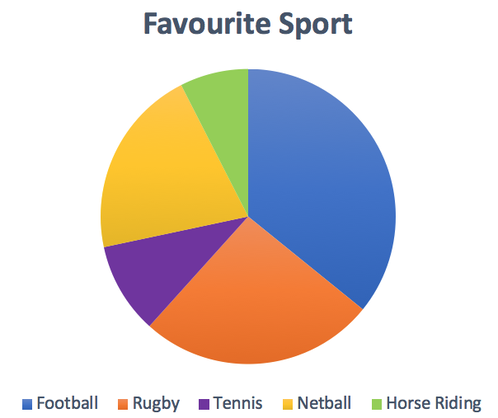
c) Draw the pie chart.
d) What is the mode?
3) We are given data on how 7,200 people get to work. The data is shown in the table below.
b) Fill in the table.
c) Draw the pie chart.
d) What is the mode?
3) We are given data on how 7,200 people get to work. The data is shown in the table below.
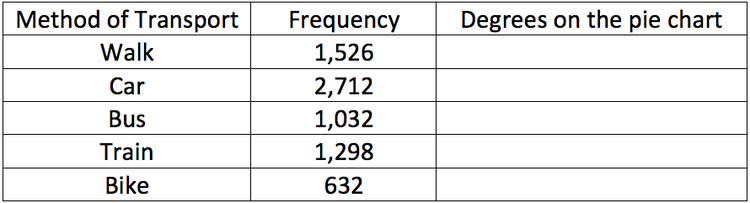
a) How many degrees does 1 person represent?
b) Fill in the table.
c) Draw the pie chart.
d) What is the mode?
b) Fill in the table.
c) Draw the pie chart.
d) What is the mode?