Back to AQA Analysing Data (H) Home
Analysing Data: Quiz 4
Analysing Data: Quiz 4
You may use a calculator for the following questions. Click here for a printable version of the tables and data.
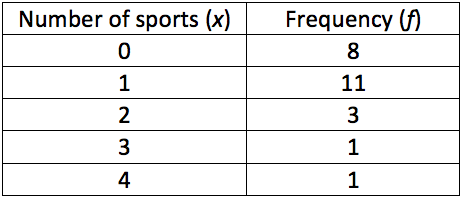
1) The frequency table below shows the number of sports that students in my class play.
1) The frequency table below shows the number of sports that students in my class play.
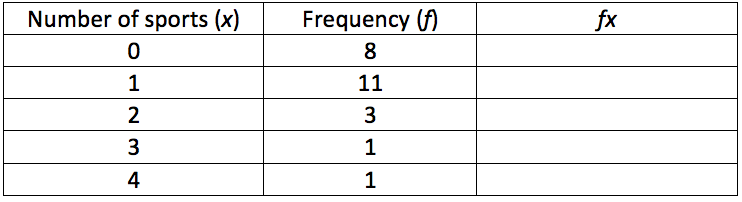
a) Complete the table below and find the mean for the data.
b) What is the mode?
c) What is the range?
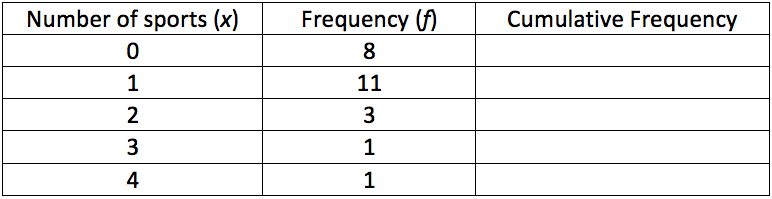
d) Complete the table below and find the median.
c) What is the range?
d) Complete the table below and find the median.
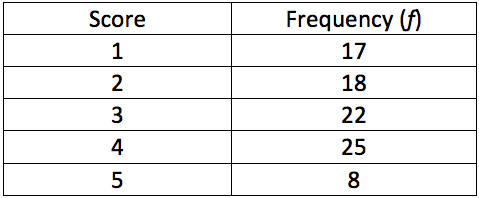
2) 90 people take a 5-question quiz. Their results are shown in the table below.
a) What is the mode?
b) What is the mean? Give your answer to one decimal place and show your working.
c) What is the median? Show your working.
d) What is the range?
3) I train for 4 different sports; running (R), football (F), horse riding (H) and boxing (B). I record all of the training sessions that I under take in a month. The data is shown below:
R, R, H, B, B, R, H, F, F, R, B, H, F, F, H, R, H, B, F, F, R
a) Complete the frequency table below.
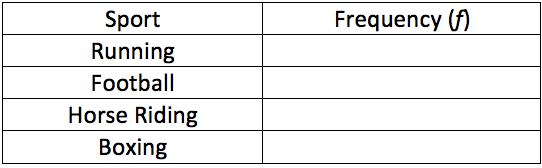
b) What is the modal sport?