Paper 1 H - SAMPLE SET 1 Q3
3) The National Grid ensures that the supply of electricity always meets the demand of the consumers.
Figure 2 shows how the output from fossil fuel power stations in the UK varied over a 24-hour period.
Figure 2 shows how the output from fossil fuel power stations in the UK varied over a 24-hour period.
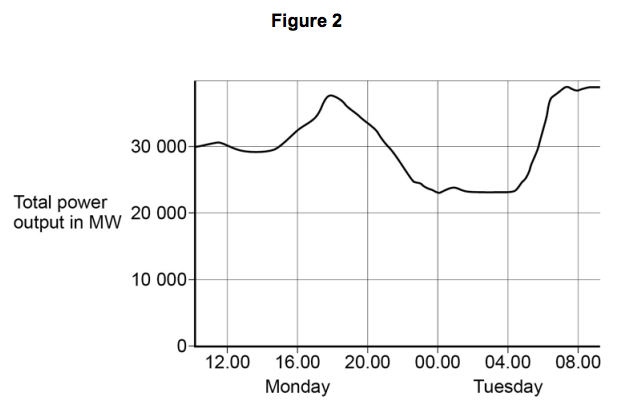
3.1) Suggest one reason for the shape of the graph between 15.00 and 18.00 on Monday. [1 mark]
3.2) Gas fired power stations reduce their output when demand for electricity is low.
Suggest one time on Figure 2 when the demand for electricity was low. [1 mark]
3.3) The National Grid ensures that fossil fuel power stations in the UK only produce about 33% of the total electricity they could produce when operating at a maximum output.
Suggest two reasons why. [2 marks]
1. _____________________________________
2. _____________________________________
(Total for Question 3 = 4 marks)