q3
7) A student investigates how the average speed of the trolley varies with starting height.
Figure 9 shows the trolley and runway.
Figure 9 shows the trolley and runway.
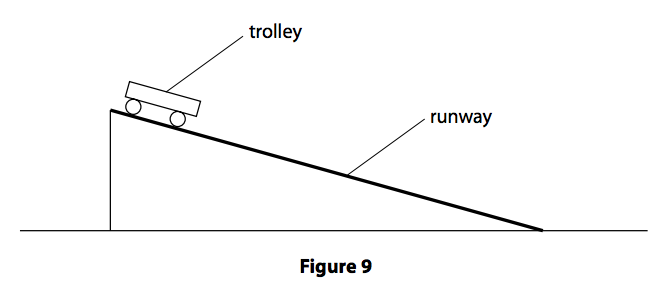
(a) Describe how the student can determine the average speed of the trolley. (4)
(b) Figure 10 shows his results.
(b) Figure 10 shows his results.
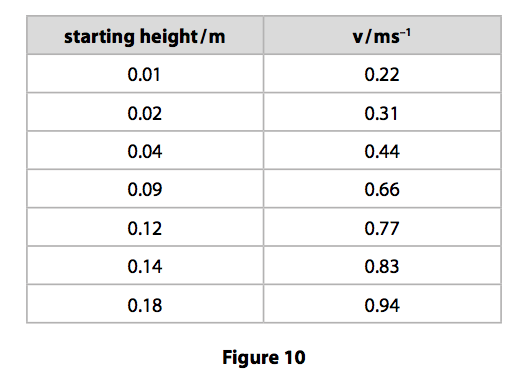
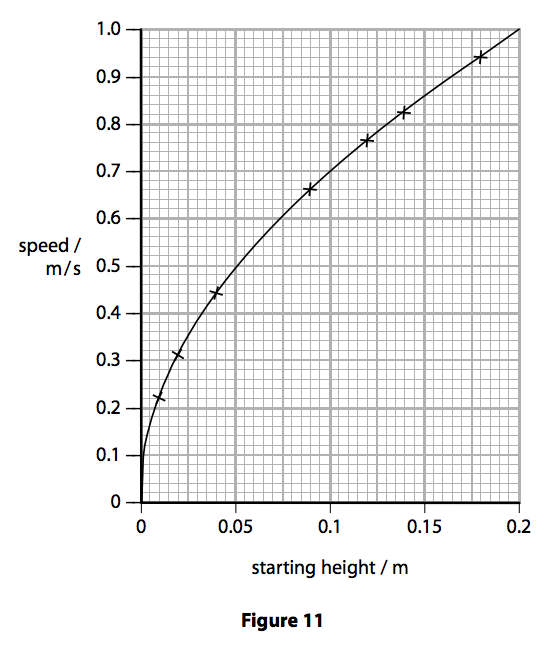
Figure 11 shows the student’s graph.
(i) The trolley has a mass of 650g.
Calculate the average kinetic energy of the trolley which had a starting height of 0.075m. (2)
Calculate the average kinetic energy of the trolley which had a starting height of 0.075m. (2)
average kinetic energy= ................................................ J
(ii) Determine the gradient of the graph when the height is 0.1m. (2)
gradient = ................................................
(iii) Describe how the speed of the trolley varies with the changes in height made by the student between 0.04 m and 0.12 m. (2)
(c) The student wants to change his experiment to investigate how different surfaces of the runway affect the speed of the trolley down the slope.
Devise an experiment that would allow him to investigate the effect of different surfaces on the average speed of the trolley. (3)
(Total for Question 7 = 13 marks)