Back to Edexcel Multiples & Factors (F) Home
1.4 H) Venn Diagrams
1.4 H) Venn Diagrams
Another way that we can work out the highest common factor and lowest common multiple of two numbers is to use a Venn diagram. I will explain how the Venn diagram method works through an example.
Example 1
Draw a Venn diagram to work out the highest common factor and lowest common multiple for 30 and 42.
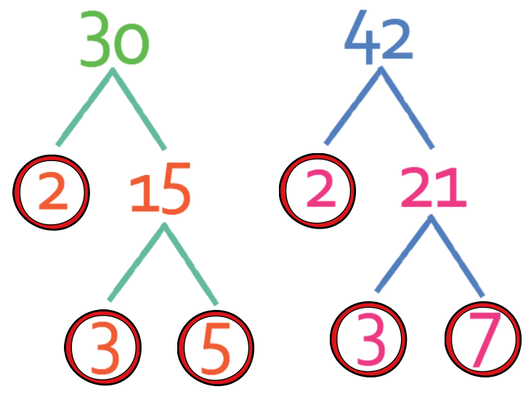
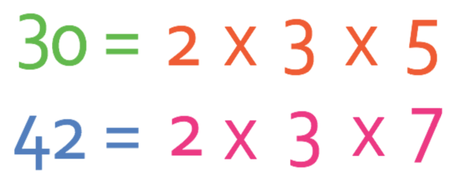
Let’s first use factor trees to write these two numbers as a product of their prime factors.
Draw a Venn diagram to work out the highest common factor and lowest common multiple for 30 and 42.
Let’s first use factor trees to write these two numbers as a product of their prime factors.
A blank Venn diagram is shown below.
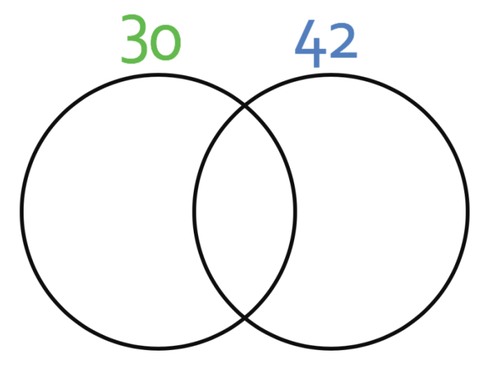
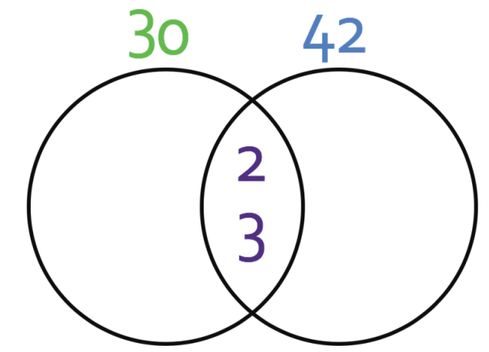
The left circle will contain all of the prime factors of 30. The right circle will contain all of the prime factors of 42. The cross over between the two circles will contain all of the common prime factors. Let’s find the prime factors that go into the cross over section first. 30 and 42 have two common prime factors; 2 and 3. Therefore, we place a 2 and a 3 into the cross over section (we only place one number from each of the pairs).
The circle on the left will contain all of the prime factors in 30; this circle must contain a 2, a 3 and a 5. This circle is split into two sections. One section is the cross over section, which is for prime factors that appear in both 30 and 42. The other section is for prime factors that appear in 30 and do not appear in 42. The only prime factor that appears in 30 and not in 42 is 5. Therefore, we place 5 into the part on the left.
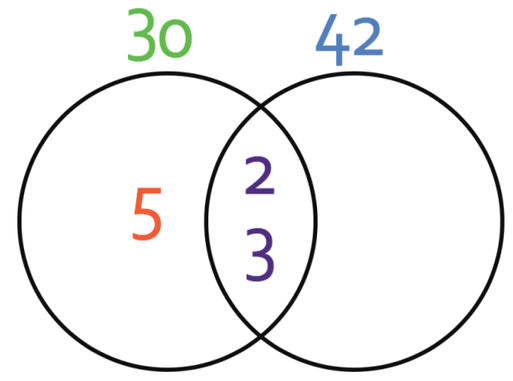
It is always a good idea to check that we have placed all of the prime factors in the 30 circle. There are 3 prime factors in 30; 2, 3 and 5. We have all of these factors inside the whole 30 circle, which means that we have not missed any factors out.
We now move onto the right circle, which is the circle for the prime factors of 42. Like the 30 circle, there are two different sections; the cross over section, which is for common prime factors in 42 and 30, and the section that is just for prime factors that are in 42 and not 30. There is only one prime factor that goes into 42 and not 30 and this factor is 7.
We now move onto the right circle, which is the circle for the prime factors of 42. Like the 30 circle, there are two different sections; the cross over section, which is for common prime factors in 42 and 30, and the section that is just for prime factors that are in 42 and not 30. There is only one prime factor that goes into 42 and not 30 and this factor is 7.
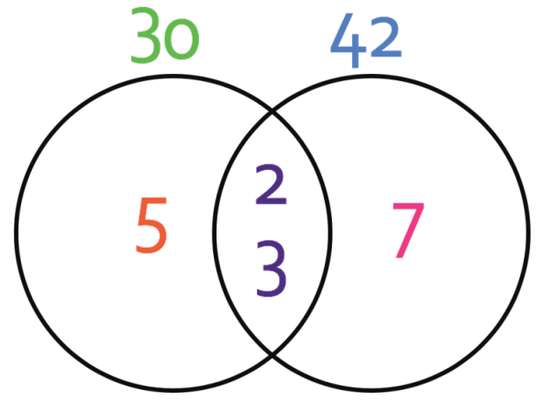
We can check to see that we haven’t missed any prime factors out by checking that all of the prime factors are in the 42 circle. 42 has 3 prime factors, which are 2, 3 and 7. All of these factors do appear inside the 42 circle, thus meaning that we have not missed any factors out.
The next step is to use the completed Venn diagram to find the highest common factor and the lowest common multiple.
We find the highest common factor by multiplying the common prime factors together. The cross over section between the two circles contains the common prime factors. Therefore, we find the highest common factor by multiplying all of the factors in the crossover section together.
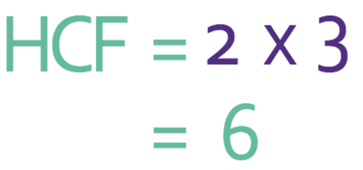
The highest common factor is 6.
The lowest common multiple is found by multiplying all of the numbers that are inside the two circles.
The lowest common multiple is found by multiplying all of the numbers that are inside the two circles.
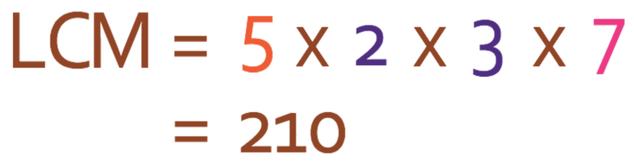
Therefore, the lowest common multiple is 210.
Final Note
The Venn diagram method is a bit of a faff, but it can help you to understand highest common factors and lowest common multiples. It is probably worth doing a few questions in the quiz. However, if you are happy with the other method for finding the highest common factors and lowest common multiples, feel free to ignore the Venn diagram method.
The Venn diagram method is a bit of a faff, but it can help you to understand highest common factors and lowest common multiples. It is probably worth doing a few questions in the quiz. However, if you are happy with the other method for finding the highest common factors and lowest common multiples, feel free to ignore the Venn diagram method.