Back to Edexcel Linear Graphs (F) Home
2.5 F) Gradient Introduction
2.5 F) Gradient Introduction
The general form of a linear line is y = mx + c. m in this formula is the gradient and c is the y intercept. The gradient refers to the slope of a line. The gradient is a measure of how much y changes when x increases by 1.
The graph below has the line y = 2x – 4
The graph below has the line y = 2x – 4
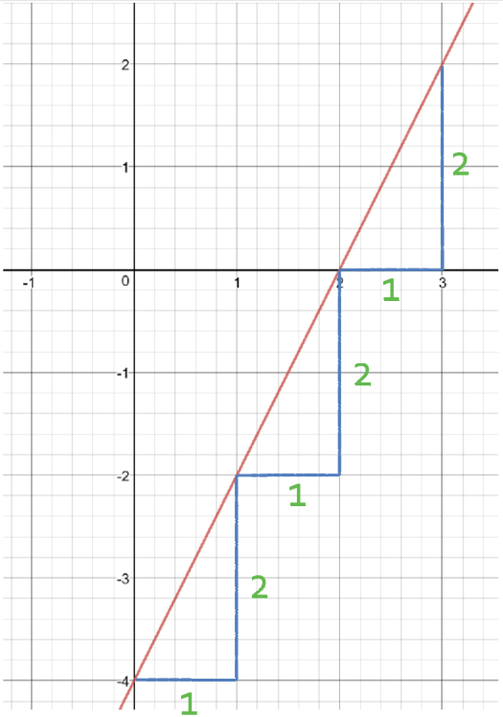
The graph y = 2x – 4
We can find the gradient of the graph by working out what the change in y is when x increases by 1 unit. There are little triangles on the graph. The bases of the triangles have a length of 1 and they represent an increase in x of 1. The height of the triangles is the change in y. From the triangles, we can see that all of the triangles have a height of 2. Therefore, the gradient of this graph is 2.
We can also find the gradient of a line from the equation of the line. We were told that the line has the equation y = 2x – 4. This graph has a value for m as 2, which means that the gradient of the line is 2.
We can also find the gradient of a line from the equation of the line. We were told that the line has the equation y = 2x – 4. This graph has a value for m as 2, which means that the gradient of the line is 2.
Positive and Negative Gradients
A positive value for the gradient (m) means that the graph is upwards sloping. A negative value means that the graph is downwards sloping.
For the graph that we have just looked at (y = 2x – 4) , the value for m was 2, which is positive and the graph was upwards sloping.
We are now going to have a look at another graph that has the equation y = -3x + 3. This graph is shown below.
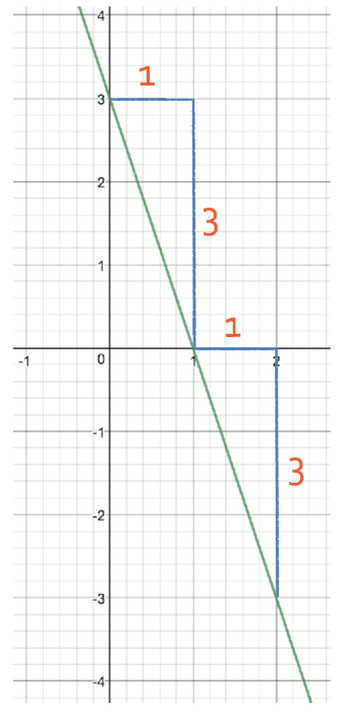
The graph y = -3x + 3
The value of m is -3, which is negative, and you can see that the graph is downwards sloping. A gradient of -3 means that as the x value increases by 1, the y value will decrease by 3. I have added some triangles onto the graph to show this. From the triangles, you can see that as the value for x increases by 1, the y value decreases by 3.
Steepness
For positive gradients, the greater the value of m, the steeper the line will be. There are 5 lines plotted on the line below. The lines are:
For positive gradients, the greater the value of m, the steeper the line will be. There are 5 lines plotted on the line below. The lines are:
- y = x; m is 1, so as x increases by 1, y also increases by 1
- y = 2x; m is 2, so as x increases by 1, y increases by 2
- y = 3x; m is 3, so as x increases by 1, y increases by 3
- y = 4x; m is 4, so as x increases by 1, y increases by 4
- y = ½x; m is ½, so as x increases by 1, y increases by ½
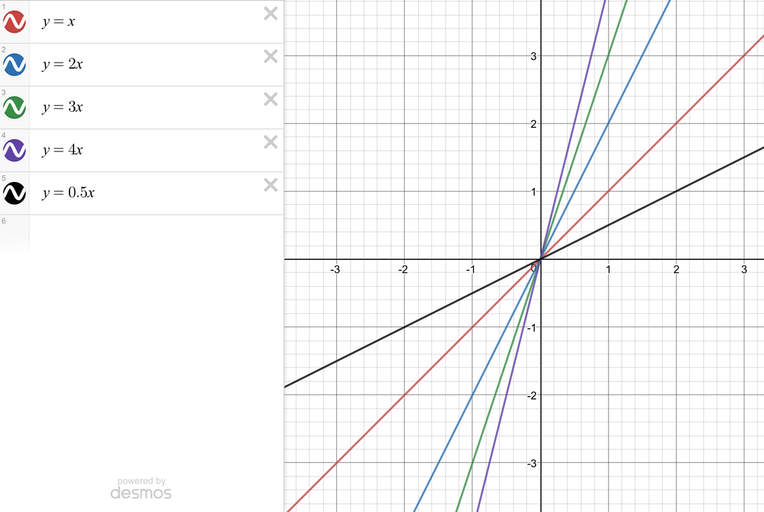
The first thing to notice from the graph is that as the values for m are all positive, all of the lines are upwards sloping. We can see that the steepest line is y = 4x and this is because it has the greatest value for m (m is 4). The line that is the shallowest is y = ½x and this line has the lowest value for m (m is ½).
We have a similar rule for downwards sloping graphs, which are graph that have a negative value for m. The more negative the gradient is, the steeper the line will be. There are 5 lines plotted on the graph below. The lines are:
We have a similar rule for downwards sloping graphs, which are graph that have a negative value for m. The more negative the gradient is, the steeper the line will be. There are 5 lines plotted on the graph below. The lines are:
- y = -x; m is -1, so as x increases by 1, y decreases by 1
- y = -2x; m is -2, so as x increases by 1, y decreases by 2
- y = -3x; m is -3, so as x increases by 1, y decreases by 3
- y = -4x; m is -4, so as x increases by 1, y decreases by 4
- y = -½x; m is -½, so as x increases by 1, y decreases by ½
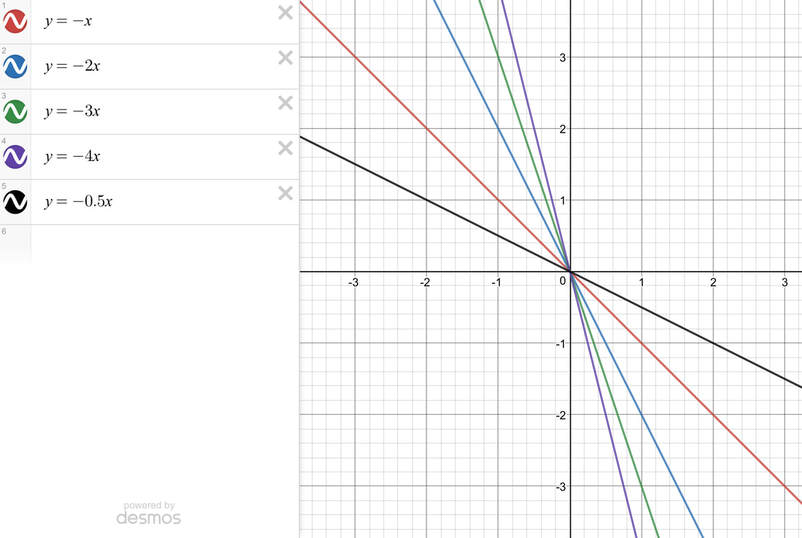
All of the 5 graphs have a negative value for m and this is why all of the lines are downwards sloping. We can also see from the graph that the line that is the steepest is the line that has the most negative value for m; this line is the purple line and it has the equation y = -4x (m is -4). The shallowest line is the line that has the least negative value for m, which is y = -½x (m is -½).